
Automated SEO Report: What to Include and How to Build It

Key Takeaways
- Automated SEO reports pull rankings, organic traffic, technical issues, and backlink data on a schedule, then refresh without spreadsheet work.
- The best reports do more than track rankings. They explain why positions moved.
- Content marketers and digital strategists gain the most from them. They publish often and need feedback this week.
- E-commerce teams should track organic conversion points and product rankings. News sites care more about impressions, bounce rate, and time on page.
- Agencies benefit here, comparing organic traffic before and after content across dozens of clients without manual entry.
- Traffic without conversions is nearly worthless. If a metric does not map to a client goal, it does not belong.
- Track a consistent brand voice across channels alongside standard KPIs, and you can see whether that consistency moves the numbers.
Why bother automating your SEO reports
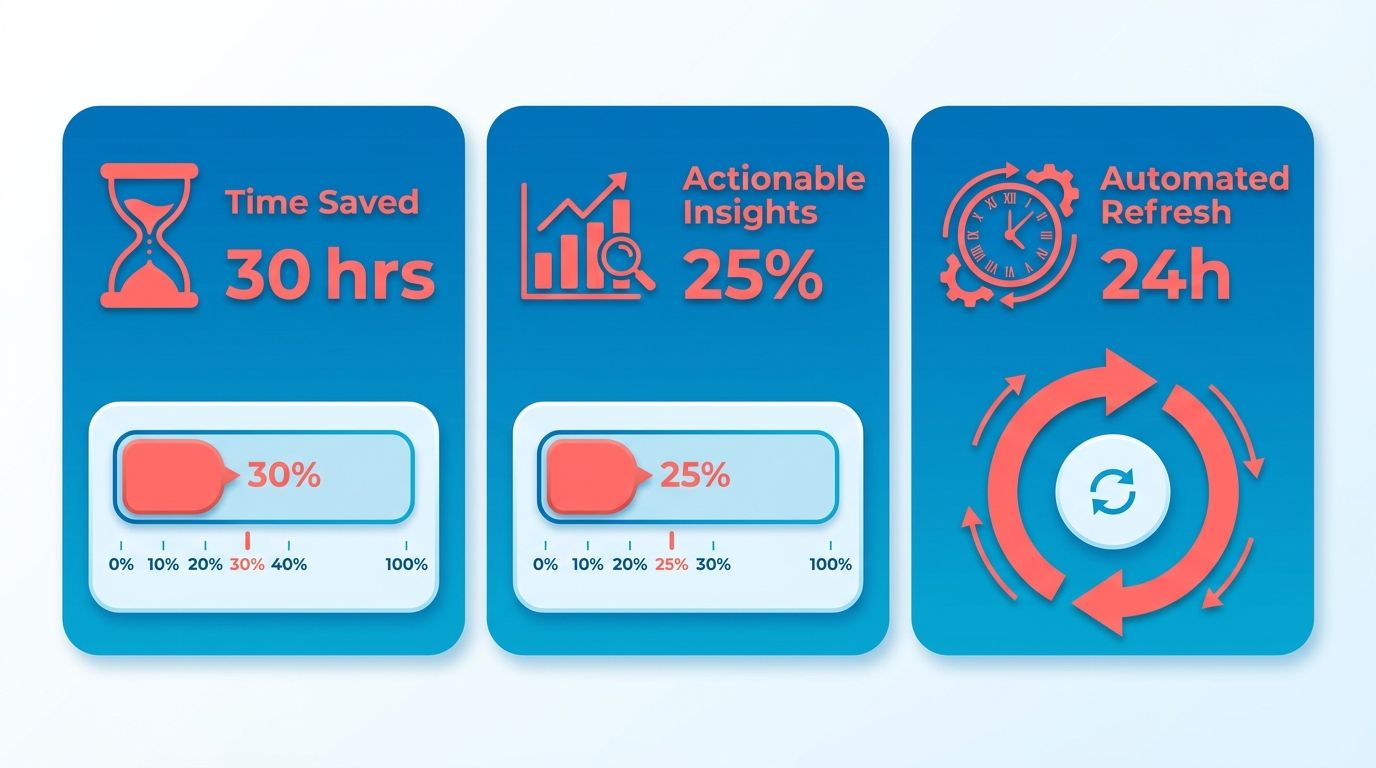
An automated SEO report buys back the hours your team spends pulling numbers by hand. Connect it to your data sources, and it updates on its own. Your marketers spend time acting on insights instead of assembling them.
Here's what separates a useful report from a pretty one: it connects performance shifts to specific content changes. That's the gap we built our reporting around. Because our Persona Engine matches new content to your brand voice as it's generated, you can track whether a unified tone across channels helps your search visibility over time.
Who actually gets value out of this
High-velocity publishing teams live and die by fast feedback. Waiting for a manual report at month-end does not work when you need indexing status and early ranking signals to adjust the editorial calendar this week.
The value changes by team. Online retailers watch cart entries and product detail page performance. Newsrooms watch reader retention and traffic spikes. Agencies get the biggest lift: reporting scales across dozens of client accounts at once, showing the impact of newly published articles without re-keying data.
Chasing raw traffic volume can mislead you. A report should surface metrics tied to business objectives, like leads or sales, not just page views that look good in a screenshot.
What automation actually fixes
Automated SEO reporting means consolidating your search performance and analytics data into one dashboard that refreshes on a schedule.
It solves three recurring headaches. Data accuracy improves because direct API connections reduce copy-paste errors. Timeliness improves because current data makes performance tracking something you can trust. Consistency improves because every reporting period runs on the same parameters, so historical comparisons hold up.
Our rule of thumb: automate the parts that run on stable data and repeat every cycle. Do not cram in every metric you can find, and never ship a report without time comparisons. A number with no "versus last month" next to it tells you nothing.
Where voice-matching fits in
This is where the standard playbook runs out. Most reports can tell you traffic rose after new content went live. Almost none tell you why. Correlate tone alignment with traffic changes, and you start to see whether style shifts are moving reader engagement.
There is a real debate here. One camp says automation collects the data while humans own interpretation. Our take is that the line is moving. Voice-matching AI automates the brand-alignment check itself. Keep a consistent tone across every generated asset, and your performance data starts showing how readers respond to that specific voice.
So when rankings shift, you are not guessing. You can check whether off-brand copy or voice drift sits behind the change. That is the difference between a report that describes performance and one that helps you fix it, across every platform you publish to.
Picking KPIs that map to your business
Not every report should track the same numbers. What matters for an e-commerce brand hunting conversion lifts looks nothing like what a news publisher needs when it is chasing impressions. We watch teams burn weeks on vanity numbers that never turn into revenue, while the signals that explain performance sit buried three tabs deep. Your report earns its place when it surfaces the handful of KPIs your business model depends on, not the full menu.
The metrics that drive real decisions
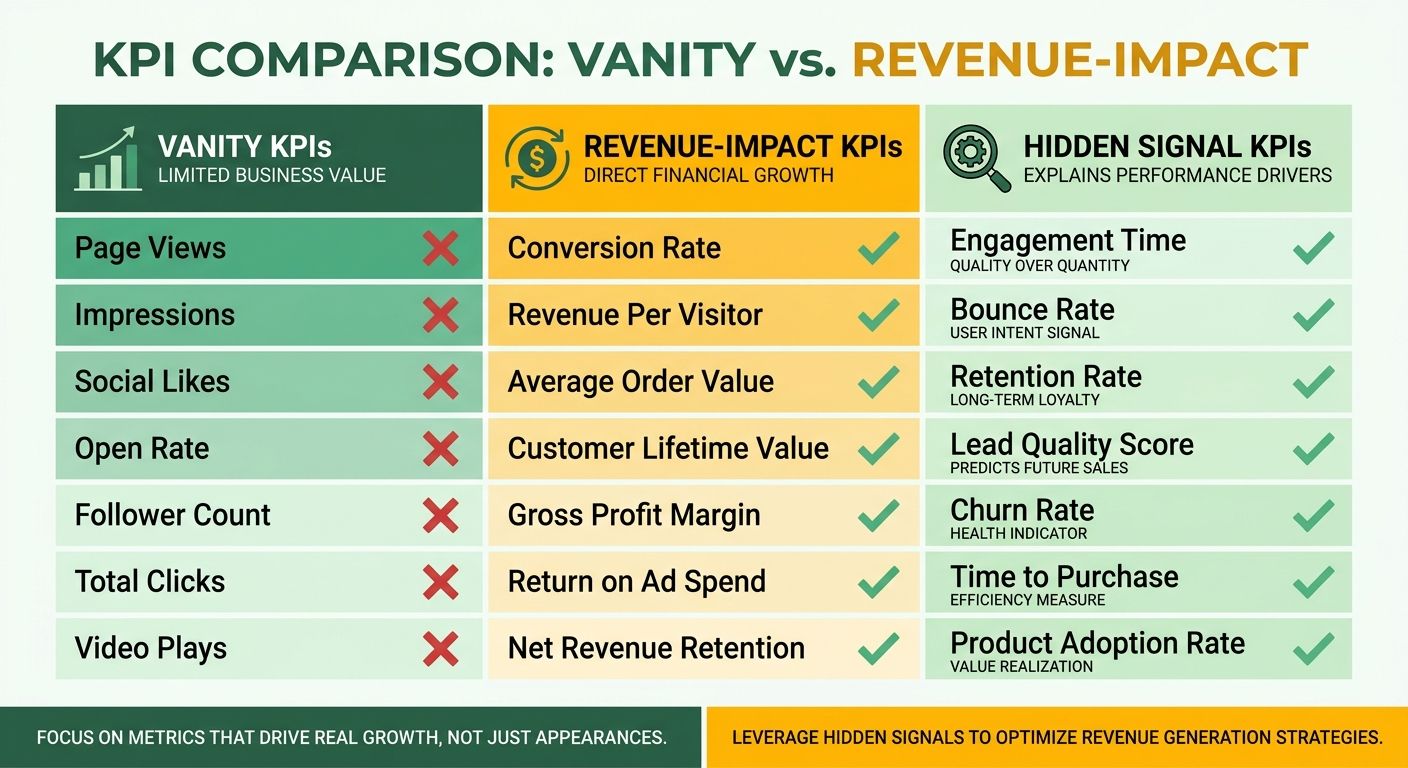
Start with what maps to your revenue model. If you sell products, organic traffic to product pages and conversion rate from search tell you whether SEO is pulling its weight. If you run a content business, impressions, time on page, and pages per session prove engagement. We have seen teams track dozens of keyword rankings while missing the real story: their top-converting landing pages lost half their traffic because a technical error killed indexation. A report that catches that in week one beats a monthly deck of ranking charts every time.
Traffic from AI search engines grew 16x from 2024 to 2026. Ignoring AI visibility now is like ignoring mobile traffic in 2012. If your audience uses answer engines, track AI Overview impressions and clicks from those placements. Google Search Console now ships a dedicated AI visibility report showing how often your content lands in AI-generated answers, and that data explains traffic shifts traditional organic metrics cannot. One company saw flat keyword rankings but rising traffic, and the answer was AI engines surfacing their content in zero-click answers, which drove brand searches later in the funnel.
How your industry shapes the list
Online retailers should prioritize checkout completions and revenue per session. Rankings matter less than whether the traffic you earn actually converts. News and media properties need scroll depth and returning visitor rate to prove content holds attention. For both, backlink velocity and technical SEO health scores work as early-warning systems. A sudden drop in crawl efficiency or a spike in broken links usually shows up about two weeks before ranking losses do.
Here is where voice-matching changes the KPI conversation. Standard reports compare traffic before and after a content launch, but they cannot isolate why performance moved. Pair brand-voice consistency with performance tracking, and you can watch engagement and conversion outcomes as each piece goes live. That turns content quality from a judgment call into something you can actually monitor.
What to leave out
Skip metrics that do not predict outcomes. Domain Authority sounds authoritative, but it is a third-party score with no direct line to Google's ranking algorithm. Total indexed pages inflates when you publish thin content, so growth there can hide quality problems. The first organic result averages a 31.7% click-through rate, which makes raw impression counts less useful than impression share for your target keywords. You need to know what percentage of available searches you are capturing, not just how often you showed up.
Pulling in visitors who never act just wastes budget. If your report shows a surge in monthly visitors but flat form submissions, the traffic source or the landing page is broken. We have seen teams celebrate spikes from branded queries while missing that their core category keywords lost ground to competitors. The report should flag ranking drops for revenue-driving terms and surface pages with high traffic but low engagement so you can fix them before they bleed budget.
One more carve-out. If your content production is manual and infrequent, do not build a daily report. The data will not move fast enough to justify the cadence. Weekly or biweekly matches the speed at which most teams can actually respond. But if you are shipping multiple pieces a day, real-time tracking of new content indexation speed and initial ranking performance helps you catch publishing errors before they compound. Match the frequency to how fast you can act, not to an arbitrary schedule.
Connecting your data sources and keeping them connected
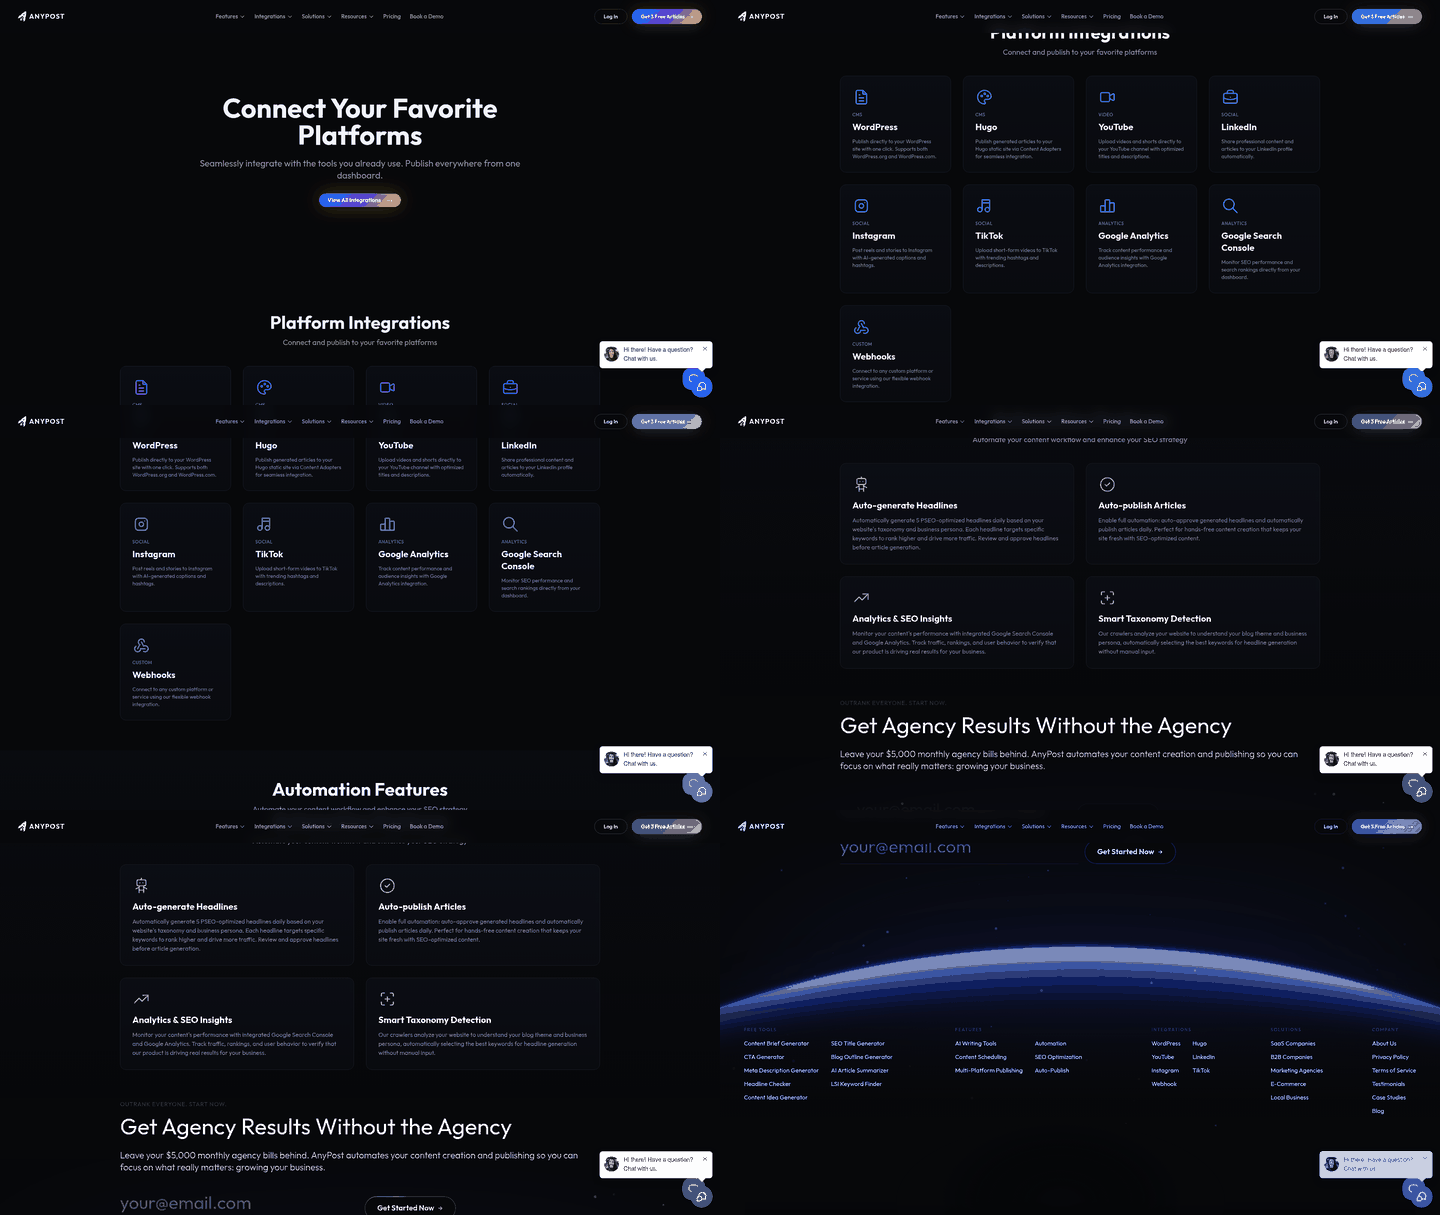
An automated SEO report works when the data arrives and keeps arriving. Most teams start with good intentions, then watch the dashboard go stale when one API key expires or a connector breaks. Integrating data sources is not about hooking everything up once. It is about building retrieval that survives product updates, permission changes, and the everyday chaos of a marketing stack.
The sources fall into three layers: search performance (Google Search Console, Google Analytics), content health (crawl data, page speed, indexing status), and off-page signals (backlinks, social shares, brand mentions). Search Console and GA4 are the foundation. Search Console gives you query-level performance (clicks, impressions, average position), while GA4 shows how that traffic converts once it hits your site. When form submissions spike after new guides go live, you can double down on what is working, a call you'd miss if you were still assembling spreadsheets by hand.
Which connectors actually stay current
Integrations do not age equally. Native platform APIs (Google Search Console API, GA4 Data API, social platform APIs) update automatically when the parent product changes, so you are less likely to wake up to a broken dashboard. Third-party aggregators that scrape data or lean on unofficial endpoints fail more often. We prioritize direct API access over screen-scraping tools. When a platform shifts its UI, the scraper breaks, but the API usually just needs a version bump.
The trap is over-connecting. Answer-engine visibility matters more every quarter, but that does not mean you plug in every possible source. Start with the metrics that answer your actual business questions. E-commerce sites should weigh sales conversions over total impressions. Publishers should watch time on page and bounce rate to see whether the audience is engaged. Modular report builders let you add sections per client instead of forcing everyone into one template.
How you keep the pipeline from breaking
Automation only saves time if it keeps running. The usual killers are expired OAuth tokens, rate-limit collisions when multiple reports hit the same API at once, and schema changes when a platform renames a field. Error notifications let teams catch failed pulls right away instead of serving stale numbers. Platforms that handle token refreshes and version updates on their own reduce manual intervention, which is what makes automated reporting sustainable.
Voice-matching adds a diagnostic layer here. When the generation engine creates content, it already knows whether that piece aligns with your brand guidelines. Track how consistent-tone content performs against content without that alignment, and you get a feedback loop rather than a flat before-and-after chart. Standard tools show you traffic moved. This shows you patterns in how your audience responds to different content styles.
Validation and error handling
Automated does not mean unsupervised. GA4's AI Assistant channel now routes traffic from AI assistants into a dedicated bucket, but if your setup predates that feature, those visits might land in "Other" or get misattributed to direct traffic. Check your channel groupings before you trust the numbers. Same with Search Console's API, which returns up to 1,000 rows per query by default. Track more keywords than that and you need pagination logic, or you will silently lose data.
Comparing daily traffic against recent baselines catches most pipeline errors. If today's organic traffic is 90% lower than yesterday's and nothing in the industry changed, that's almost certainly a collection issue, not a ranking collapse. Simple threshold checks flag most problems before they reach a client report. Store raw API responses alongside your processed metrics so you can audit anomalies later without re-pulling history.
One thing sources rarely say out loud: automation does not replace analysis. The tools can assemble the numbers and even generate AI summaries, but deciding what a 15% traffic drop means, whether it is a seasonal shift, an algorithm update, or a technical issue, still takes judgment. The setups that work automate collection and formatting, then surface the patterns a human or, in our case, voice-matching AI needs to interpret. That split keeps reports actionable instead of just accurate.
Structuring the report: sections and visuals that earn their space

A strong report reads top-down: plain-language summary first, hard numbers second, diagnosis last. Lead with an executive summary that answers one question in three sentences: did organic performance improve, and why? Then layer in a KPI dashboard and trend analysis so anyone scanning gets the headline before the detail.
Most reports stop at what moved. Ours ties performance tracking to content generated in your brand voice, so the before-and-after ranking story connects to what you actually published, not just a chart.
The four sections that carry the weight
Skip the rest.
- Executive summary: the one-paragraph verdict for stakeholders who will not scroll. State the trend and the driver.
- KPI dashboard: visibility, organic traffic, conversions, and now answer-engine visibility. Tracking how often your content shows up in AI-generated summaries keeps you current with how people actually search.
- Trend analysis: every number needs a time comparison. A ranking without a prior period is a data point, not a trend.
- Performance tracking: watching how published content behaves as a variable behind ranking shifts.
One caveat: resist the urge to include every available metric. Vanity numbers rarely map to revenue. The test is not old metric versus new. It is whether the number explains performance your business actually cares about.
Design visuals that explain, not just display
Match the visual to the question. Line charts show trends over time. Tables handle exact comparisons like keyword-level position changes. Bar charts rank pages or channels against each other. Pick the form that answers the reader's question in one glance.
Add benchmarks that give stakeholders a decision framework. Pages ranking 11-20 typically see less than 5% of total search clicks, which makes page-two improvements low-priority unless the keyword drives high-value conversions. Annotate visuals with thresholds like that so readers know where to focus, not just where the numbers moved.
Where automation stops and judgment begins
Automation owns data assembly and formatting. Interpretation used to be purely human. That line is moving.
Some argue automation alone is not enough, that effective reporting still needs a person to read the meaning. We mostly agree on interpretation. But AI can now automate the brand-consistency check across every platform, flagging tone alignment before the data even hits the report.
Our take: let automation handle content creation, publishing, and brand-voice matching. Keep humans on strategy and the next-step call. Pair a live dashboard for clients who want self-serve access with performance tracking, and you get a report that refreshes itself and still reads like a person made sense of it. That is what separates a report people act on from one they archive unread.
Building templates and scheduling delivery
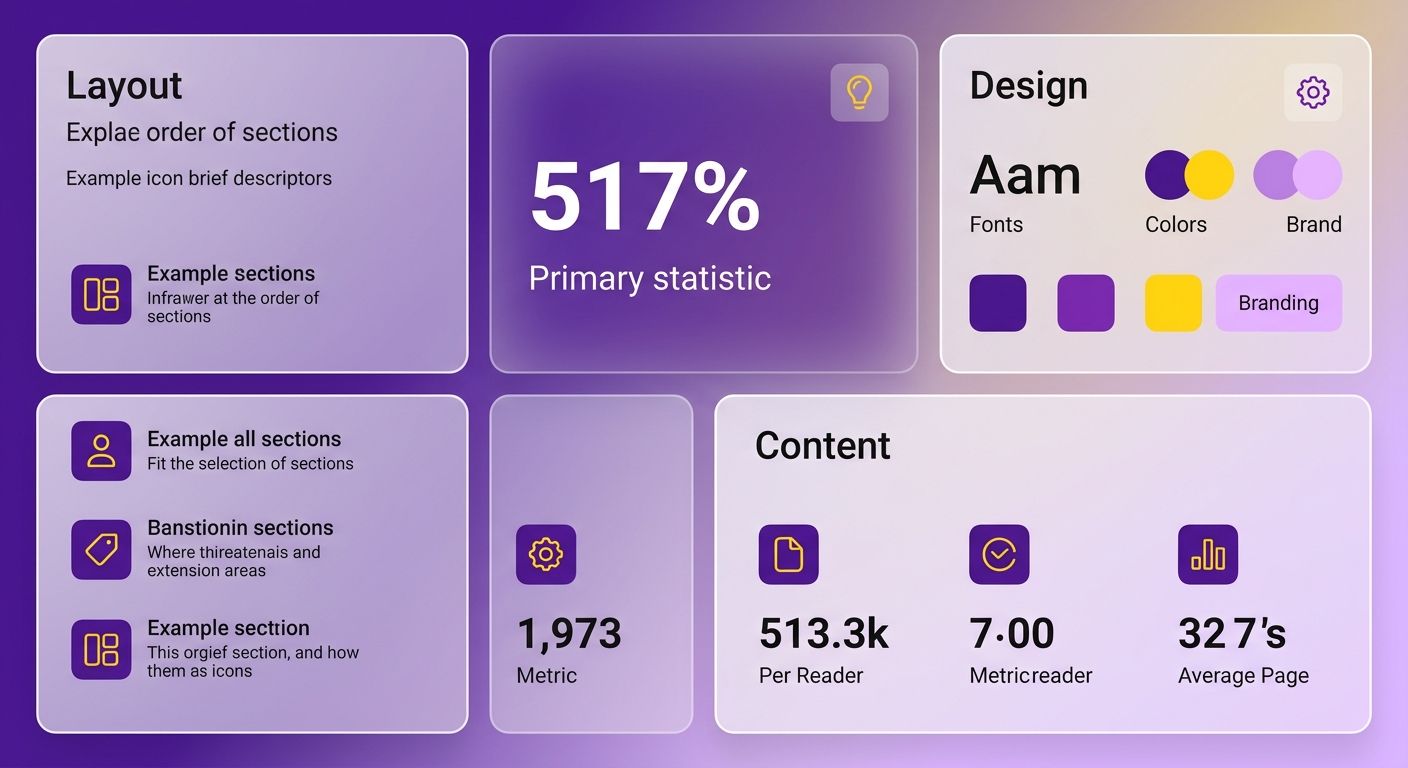
A template is where your automated SEO report stops being a data dump and starts sounding like your team. Customization comes down to three things: layout, design, and content. Get these right once and every scheduled report inherits them.
We build templates around a simple test: does each block explain performance the reader actually cares about? Live dashboard tools like Google Data Studio work well when a stakeholder wants to click into the numbers. Flexible layouts let you toggle sections per client, so a product team sees conversion data while an executive sees a one-line summary. Report generators can white-label the output, swap fonts and colors, and produce a branded PDF quickly.
A template that reflects your brand voice
Start with the reader, not the metrics. Map each stakeholder to the three or four numbers that drive their decisions, then cut everything else. Vanity metrics rarely translate into revenue, so a page of impression counts with no conversion context just buries the signal.
Here is where our angle changes the template itself. Standard tools can compare organic traffic before and after new content, but none tell you why that content moved. Matching your brand's tone across every piece lets you isolate voice consistency as a variable behind engagement and ranking shifts, instead of just watching the line move. That turns a flat before-and-after chart into a diagnostic.
We would also fold answer-engine visibility in as a standard block, not an add-on. Treat it as goal-relevant, same as any conversion metric. The test is not old metric versus new metric. It is whether the number explains something your reader is paid to care about.
Scheduling the delivery
Pick a cadence that matches how fast your data stabilizes, then automate delivery on that rhythm. Reports can run daily, weekly, or monthly and refresh on their own. Weekly suits fast-moving content programs. Monthly fits executive reviews, where week-to-week noise just distracts.
Schedule the format to the reader, not just the timing. Live performance tracking means stakeholders can pull data when they need it, at the depth their role requires. Executives get the top-line summary while strategists drill into the full breakdown, all from the same underlying data.
One caveat worth stating plainly. Automation owns collection and formatting, and tone-matching AI now assists with the brand-voice check. But interpretation still needs a person weighing the implications. Automate the assembly and the voice matching. Keep a human on the recommendation. And add a feedback line to every report so stakeholders can tell you when a section stopped being useful, then prune it next cycle.
Choosing a tool and keeping the data honest
Picking a tool comes down to one question: does it pull your data reliably and let you shape the report around the metrics you actually track? A good automated SEO report stands or falls on the tool behind it. The right one connects to your analytics stack, refreshes on schedule, and lets you toggle sections per reader without a rebuild.
Most tools fall into three buckets. Site auditors scan on-page factors, rankings, and technical issues quickly, covering dozens of website factors in seconds. Dashboard aggregators pull from 60-plus marketing platforms into one live view. Custom report builders white-label the output and let you select sections client by client. Match the type to your job, not the feature list.
How to evaluate a reporting tool
Test three things before you commit: integrations, customization, and pricing tied to volume. Start with a free trial and connect your real data sources. If the connectors break or the numbers do not match your source of truth, walk away.
Look at how the tool handles scale. One agency cut 63 hours a month off reporting after switching to a dashboard aggregator. Another halved its reporting time and dropped costs by nearly two-thirds. Those gains are real, but they only show up when the tool fits your client count and delivery cadence. Pay for the volume you have, not the volume you hope for.
Factor in answer-engine visibility too. A tool that cannot surface AI-generated search impressions is already behind. Treat that as a goal-relevant metric, not a novelty.
What keeps the data accurate
Accuracy comes from validation, not trust. Cross-check every automated figure against your primary sources during setup, then set alerts for stale or missing data. Automate only the reports built on stable inputs that answer the same questions each period. Skip automation for one-off, exploratory questions where the data keeps shifting.
Here is the tension worth naming. One camp says automation eliminates manual work entirely. Another insists it cannot replace human interpretation. Both are right, just about different jobs. Automation owns data assembly and formatting. The meaning-making, the "why did this move," still needs judgment. Document your data sources and refresh logic so anyone reading the report can trace a number back to its origin.
Where real-time tracking earns its keep
This is where we have pushed past the standard playbook. Most automated reports show when content published, but almost none explain why it performed. That gap is the whole game.
Live performance tracking lets you watch how each piece drives traffic, engagement, and conversions the moment it goes live. When rankings shift, you can correlate the change to specific content updates and publishing schedules instead of guessing. That collapses the old divide between automated data and human judgment, because the performance signals now surface automatically alongside your KPIs. The report stops describing performance and starts explaining it.
Frequently Asked Questions
1. What's the difference between an automated SEO report and a manual one in terms of data accuracy?
Automated reports reduce copy-paste errors by pulling data directly from APIs instead of human transcription. They also provide up-to-date performance data rather than stale snapshots, making reporting more trustworthy. The consistency comes from using standardized parameters every reporting period, enabling true period-over-period comparisons.
2. Should I track AI visibility metrics even if my traffic hasn't changed yet?
Yes, because answer engines are capturing a rapidly growing share of search queries. Your keyword rankings might stay flat while AI engines surface your content in zero-click answers, driving brand searches later in the funnel that traditional organic metrics miss entirely.
3. How often should I schedule my automated SEO report if I publish content daily?
Weekly or biweekly cadence matches most teams' ability to act on findings, even with daily publishing. Daily reports only make sense when you need to monitor indexing speed and immediate ranking shifts to catch technical publishing errors before they compound. Reporting frequency should mirror response capacity, not publishing volume.
4. What happens when my automated report shows high traffic but zero conversion improvement?
This discrepancy indicates that your traffic source or landing page experience is broken. The automated report should flag pages with high traffic but low engagement so you can optimize them. Traffic from irrelevant keywords or broken user flows holds almost no value regardless of volume.
5. Can automation explain why my rankings moved, or just report that they did?
Standard automation reports what moved but rarely explains why. Voice-matching AI changes this by tracking brand voice consistency alongside performance, turning before-and-after comparisons into diagnostic loops. When our system maintains a consistent tone across all generated content, paired with live tracking, you can identify whether off-brand copy or voice drift caused ranking shifts.
6. Do I need separate automated reports for different stakeholders, or can one report serve everyone?
One template with modular sections serves multiple readers better than separate reports. Executives need a one-line summary, product teams need conversion data, and strategists need full breakdowns. Flexible layouts let you toggle sections per reader while drawing from the same underlying data, avoiding version conflicts and reducing maintenance overhead.
7. What should I do when my OAuth token expires and breaks the entire reporting pipeline?
Choose platforms that handle token refreshes and version updates automatically rather than manual renewal. Set up error notifications to catch failed data pulls immediately instead of serving outdated numbers. Keeping raw API logs alongside processed metrics allows you to audit anomalies later without re-pulling historical data from scratch.