
Automated SEO Reporting: Scaling Content Teams with Data-Driven Insights

Key Takeaways
- Automated SEO reporting moves content teams off the monthly-review treadmill by wiring AnyPost AI articles straight into analytics.
- Live dashboards replace static PDFs, so editors can fix a weak article and republish inside the same content cycle instead of next quarter.
- StoryChief takes 3–4 hours to stand up and stays low-maintenance, one of the faster setups in the tools we tested.
- AgencyAnalytics has the shortest setup at 2–3 hours, with drag-and-drop widgets for client-ready reports.
- SE Ranking, SEMrush, and Ahrefs run 4–6 hours to configure, and maintenance lands anywhere from low to medium, which shows up in your ongoing workload.
- You get immediate visibility into traffic, rankings, and engagement without stitching CSVs together from three separate tools.
- Treat reporting as a decision engine, not a report. That lets you watch trends and edit continuously.
Quick Summary
Most content teams still learn how an article performed weeks later. They could have acted sooner. Automated SEO reporting closes that gap. Connect AnyPost's AI-generated articles to its built-in analytics, and you see traffic, keyword rankings, and engagement without pulling data by hand from four dashboards.
The key shift is treating the reporting layer as a decision engine, not a PDF you email monthly. Analytics refresh, you spot a trend, you edit the article, and you republish. It fits the normal content cadence, so you keep momentum that manual reporting often kills.
Here's the quick-reference matrix from the tools we've benchmarked. The columns cover core metrics, initial setup effort, ongoing maintenance difficulty, and the one highlight that matters most for a closed-loop workflow.
| Tool | Metrics Tracked | Setup Time (hrs) | Maintenance Difficulty | Key Highlights |
|---|---|---|---|---|
| StoryChief | Traffic, keyword rankings, click‑through rate, content health | 3–4 | Low | Direct Google Search Console sync; white‑label dashboards |
| SE Ranking | Rankings, backlinks, SERP features, conversion funnels | 4–5 | Medium | Strong white‑label reporting; API access for custom alerts |
| SEMrush | Organic traffic, keyword difficulty, site audit scores, SERP visibility | 5–6 | Medium | Integrated competitive gap analysis; scheduled PDF exports |
| Ahrefs | Backlink profile, keyword positions, content gaps, traffic trends | 4–5 | Medium | Deep backlink analytics; real‑time rank tracker |
| AgencyAnalytics | Traffic, goal completions, keyword trends, client‑ready reports | 2–3 | Low | Drag‑and‑drop widgets; multi‑client view with automated email bursts |
Which metrics actually close the loop?
Track the data points that tell you what to change next, not the ones that pad a slide. Traffic growth, keyword rank movement, engagement rate, and conversion signals give you a full read on how a piece is doing in the wild. Keeping them on one screen kills the data-silo problem you get from juggling separate tools.
- Traffic growth shows the net effect of publishing plus any edits you made after.
- Keyword rank movement tells you whether the SEO intent still holds.
- Engagement rate (bounce, time on page) flags when the content isn't matching what readers wanted.
- Conversion signals (form fills, clicks) tie the SEO win to an actual business outcome.
How long does a working closed-loop setup take?
A few days, usually, depending on team size and what you've already integrated. Most of the work is connecting the content engine to the reporting API and mapping metrics to the dashboard.
- Connect data sources – link Google Search Console, Analytics, and AnyPost's AI content engine.
- Configure metric widgets – pick the core metrics and set sensible thresholds.
- Test the feedback loop – publish a test article, make a tweak, confirm the analytics reflect the change.
Already on a reporting SaaS with API access? You'll move faster. If not, budget time for authentication and permission setup. That's where most first-timers stall.
How do we judge difficulty and ROI per tool?
We rate difficulty low/medium/high on required technical skill and ongoing upkeep. ROI shows up in two places: labor saved through automation and performance gains from content you can actually see and fix.
- Low difficulty tools (StoryChief, AgencyAnalytics) let a non-technical marketer launch the loop with almost no training.
- Medium difficulty tools (SE Ranking, SEMrush, Ahrefs) give you deeper data but want a short onboarding session first.
Start with low-difficulty tools to prove the concept. Move to a richer suite once the team is comfortable with the cadence. Buying the heavy tool first is how you end up with a $500/month dashboard nobody opens.
What you stop doing once reporting runs itself
Fold data collection, metric calculation, and insight delivery into one workflow. You free analysts from spreadsheet gymnastics. That's the point. Less exporting, more deciding.
- AnyPost's real-time tracking aggregates ranking and performance data, so no more nightly CSV exports.
- The analytics view surfaces impression drops or crawl-issue spikes early, while you can still do something about them.
- Because the dashboard updates continuously, the weekly status meeting that used to eat hours of prep just goes away.
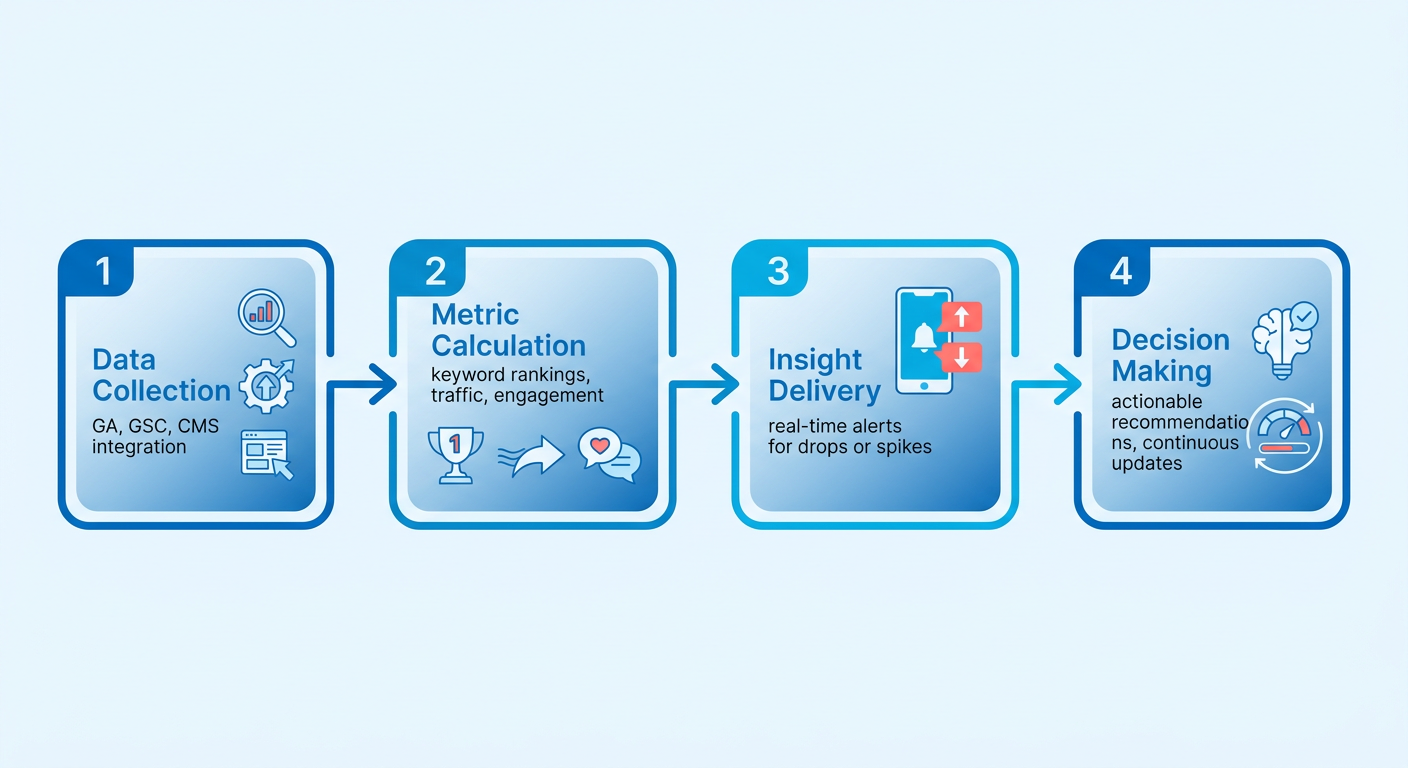
Teams running integrated AI-content and reporting in one system report less manual effort and fewer technical hiccups. Not a surprise, but worth saying out loud.
What real-time signals let you fix content faster
The dashboard shows performance shifts the moment they happen, so you ship updates now instead of waiting for the monthly cycle.
- A keyword rank change triggers a suggested copy adjustment, like adding a long-tail phrase that just cracked the top 10.
- Schema validation runs on every publish and flags missing markup before Google crawls the page.
- Continuous site-health monitoring catches broken links and slow-loading pages before they drag rankings down.
Pair those signals with AnyPost's AI-generated drafts, and the loop actually closes. The article gets created, published, measured, and refined inside a single sprint.
Who gets the most out of this
Content creators, digital strategists, and growth leaders all gain visibility, but what they do with it differs.
- Content creators see which headings, images, or CTAs actually move the needle, so they iterate on evidence instead of taste.
- Digital strategists get one source of truth across markets, which simplifies cross-team reporting and budget conversations.
- Growth leaders can tie SEO metrics to revenue forecasts and make the case for scaling production.
Because reporting lives in the same system that generates the copy, you dodge the disconnected-tools pitfall that slows teams down. That's how you standardize reporting across campaigns and keep SEO pointed at business goals instead of vanity charts.
Defining Key SEO KPIs for Automated Dashboards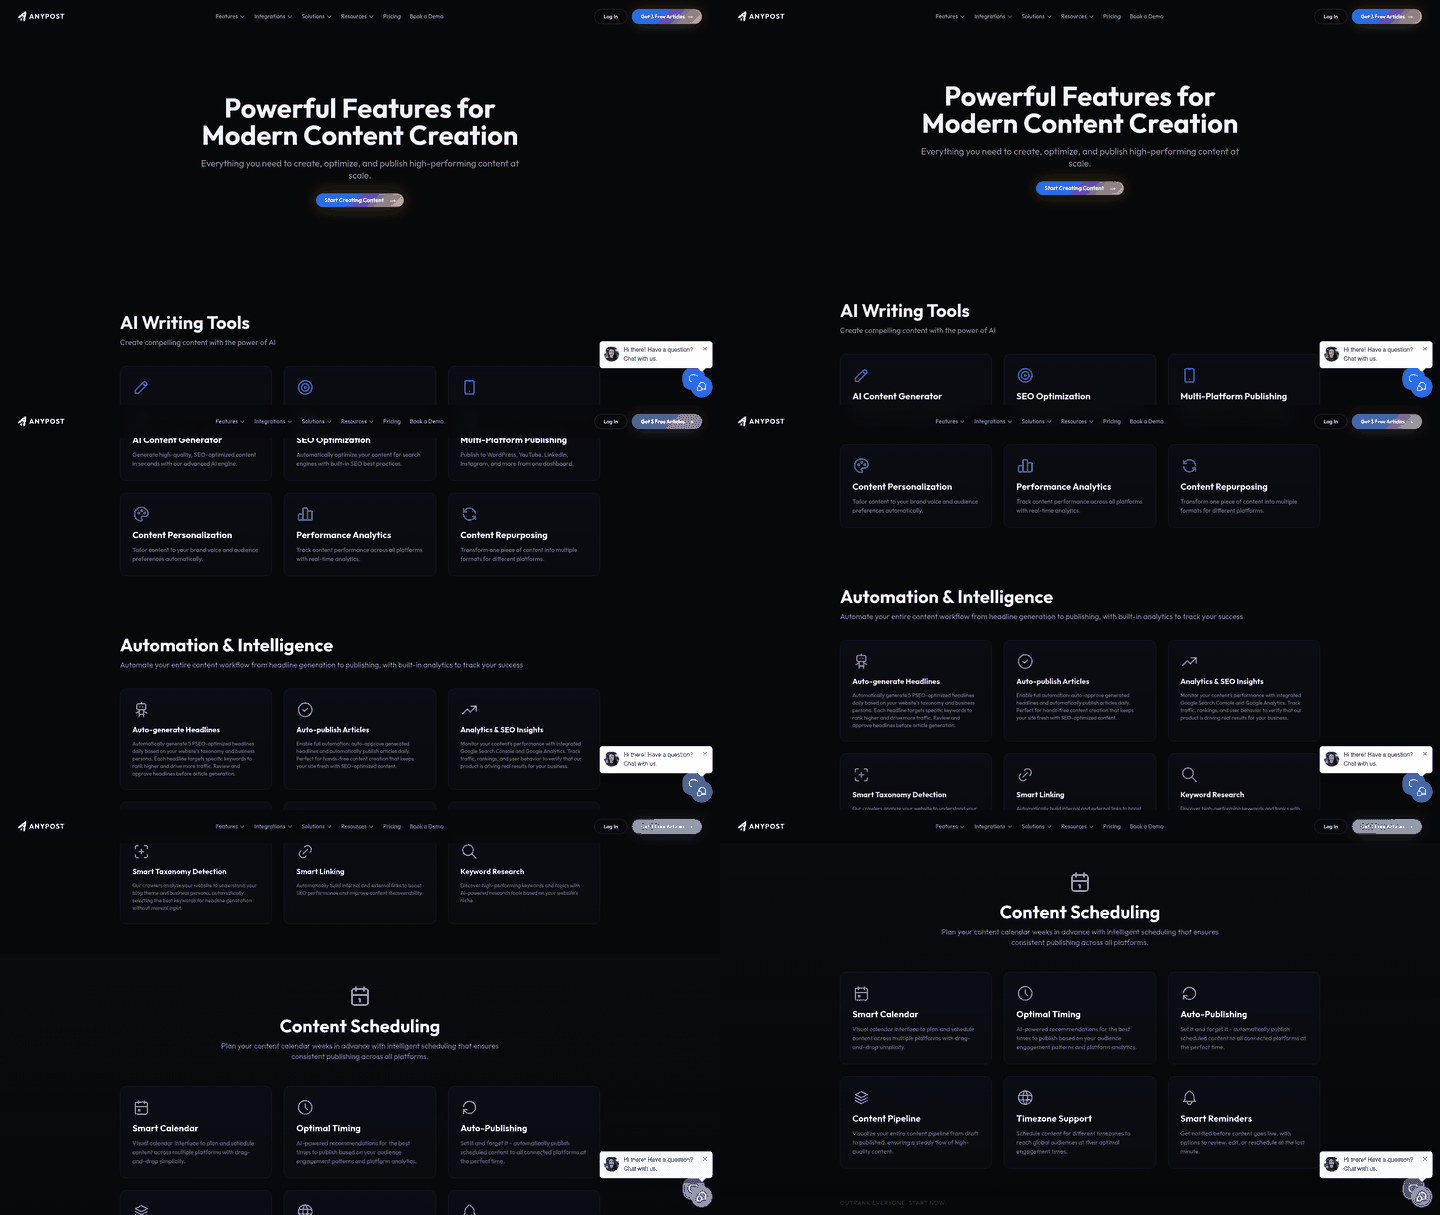
Automate the reporting layer, and AI-generated drafts turn into measurable signals the second they go live. AnyPost's real-time analytics let creators watch organic traffic, click-through trends, and engagement as edits land.
The trick is surfacing the KPIs that drive decisions on one screen, so editors can revise copy right from the performance view instead of tabbing between tools.
Which KPIs earn a spot on the dashboard
These are the core SEO KPIs that drive decisions on AI-created content:
- Organic traffic – search visitors, segmented by entry page, so you know which topics pull interest.
- Engagement rate – session duration plus interaction depth, a read on whether the content satisfied intent.
- Keyword ranking velocity – how fast target terms move up or down, which matters more now that zero-click SERPs dominate.
- SERP visibility – presence in results, including featured snippets and other prominent placements.
"SEO reporting in 2026 focuses on visibility across zero‑click SERPs, multi‑touch revenue paths, and overall engagement rather than just ranking changes." – industry analysis
A dashboard that only shows rank positions misses most of the user journey. Combine traffic, engagement, and SERP visibility, and you get a complete performance picture that tells you what to write next.
Building the closed-loop dashboard
Start by mapping each KPI to a data source (Google Search Console, the AI content engine, a web-analytics platform). Then configure a unified view that refreshes on its own:
- Ingest – the system pulls raw metrics automatically, so nobody's hand-collecting data.
- Normalize – align timestamps and units so a traffic spike and an engagement dip show up side by side.
- Alert – threshold rules flag sudden visibility drops and prompt the editor to open the article straight from the dashboard.
Because the dashboard connects to the editor, you can modify a flagged page, rework the headline, or add schema, and push it live immediately. Updated metrics come back shortly after and tell you whether the change worked.
When to skip a metric on purpose
Skip granular crawl-error counts for small sites publishing fewer than 200 pages a month. The signal-to-noise ratio is too low, and the effort isn't worth it. Use the same logic for click-through-reduction tracking on AI-generated answers when the goal is brand awareness rather than direct traffic. Watch overall impression share instead.
Tailoring the KPI set to your team's size and goal is what prevents dashboard fatigue and keeps the loop tight. Surface the right metrics, and teams iterate faster, spend less on manual labor, and capture the extra organic impressions automation tends to leave on the table.
Automated Content Gap Analysis for Growth
A content-gap analysis compares what people are searching for against the assets you already have. Overlay that on AnyPost's analytics view, and you see traffic potential, keyword difficulty, and any SEO factors that could hurt rankings. What comes out is a prioritized to-do list that feeds straight into your content workflow.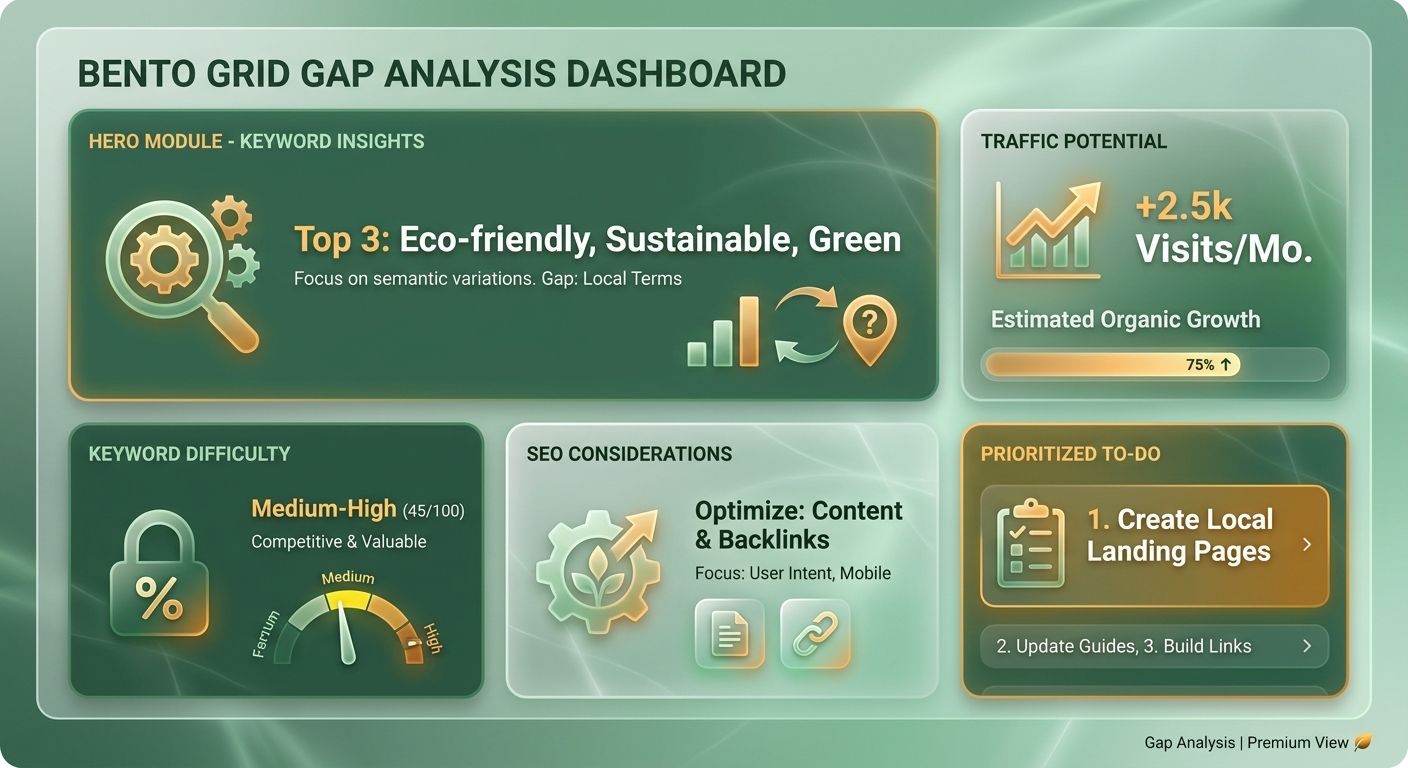
How we run a gap analysis
- Gather keyword insights – AnyPost's taxonomy researcher pulls search demand relevant to your business context.
- Map to existing assets – the platform cross-references those signals against your content library and flags unmatched intents as gaps.
- Prioritize by impact – gaps get ranked on estimated monthly impressions, relevance to your audience, and your domain strength.
Run it on a schedule that matches your publishing cadence, and the gap list stays current as market interest shifts.
What the platform surfaces
The built-in tracking highlights the signals worth acting on:
- Keyword performance – impressions, clicks, and ranking trends per term.
- Traffic trends – which pages are gaining or bleeding visits over time.
- SEO health indicators – basics like page-speed scores and indexability you can fix in your workflow.
These help you catch opportunities and patch problems before they touch rankings.
Closing the loop and publishing
Once a gap is prioritized, AnyPost's Persona Engine drafts something in your brand's voice. After a quick editorial review, you publish straight to any connected channel (WordPress, LinkedIn, X). Performance metrics for the new piece show up in the analytics view within minutes, so you can confirm the impact of each update.
"AI‑driven content tools enable teams to streamline analysis and focus on creating high‑value assets."
Best-practice checklist
- Schedule gap analyses at a cadence that matches your content velocity.
- Assign each gap to an owner in your project-management tool.
- Treat the AI draft as a starting point, then refine for brand voice.
- Check post-publish performance in the analytics view to verify the lift.
Fold gap detection, insight tracking, and AI-assisted drafting into one workflow, and the data stops sitting in a report. It turns into the next thing you publish.
Integrating GA, GSC, and CMS Data into Automation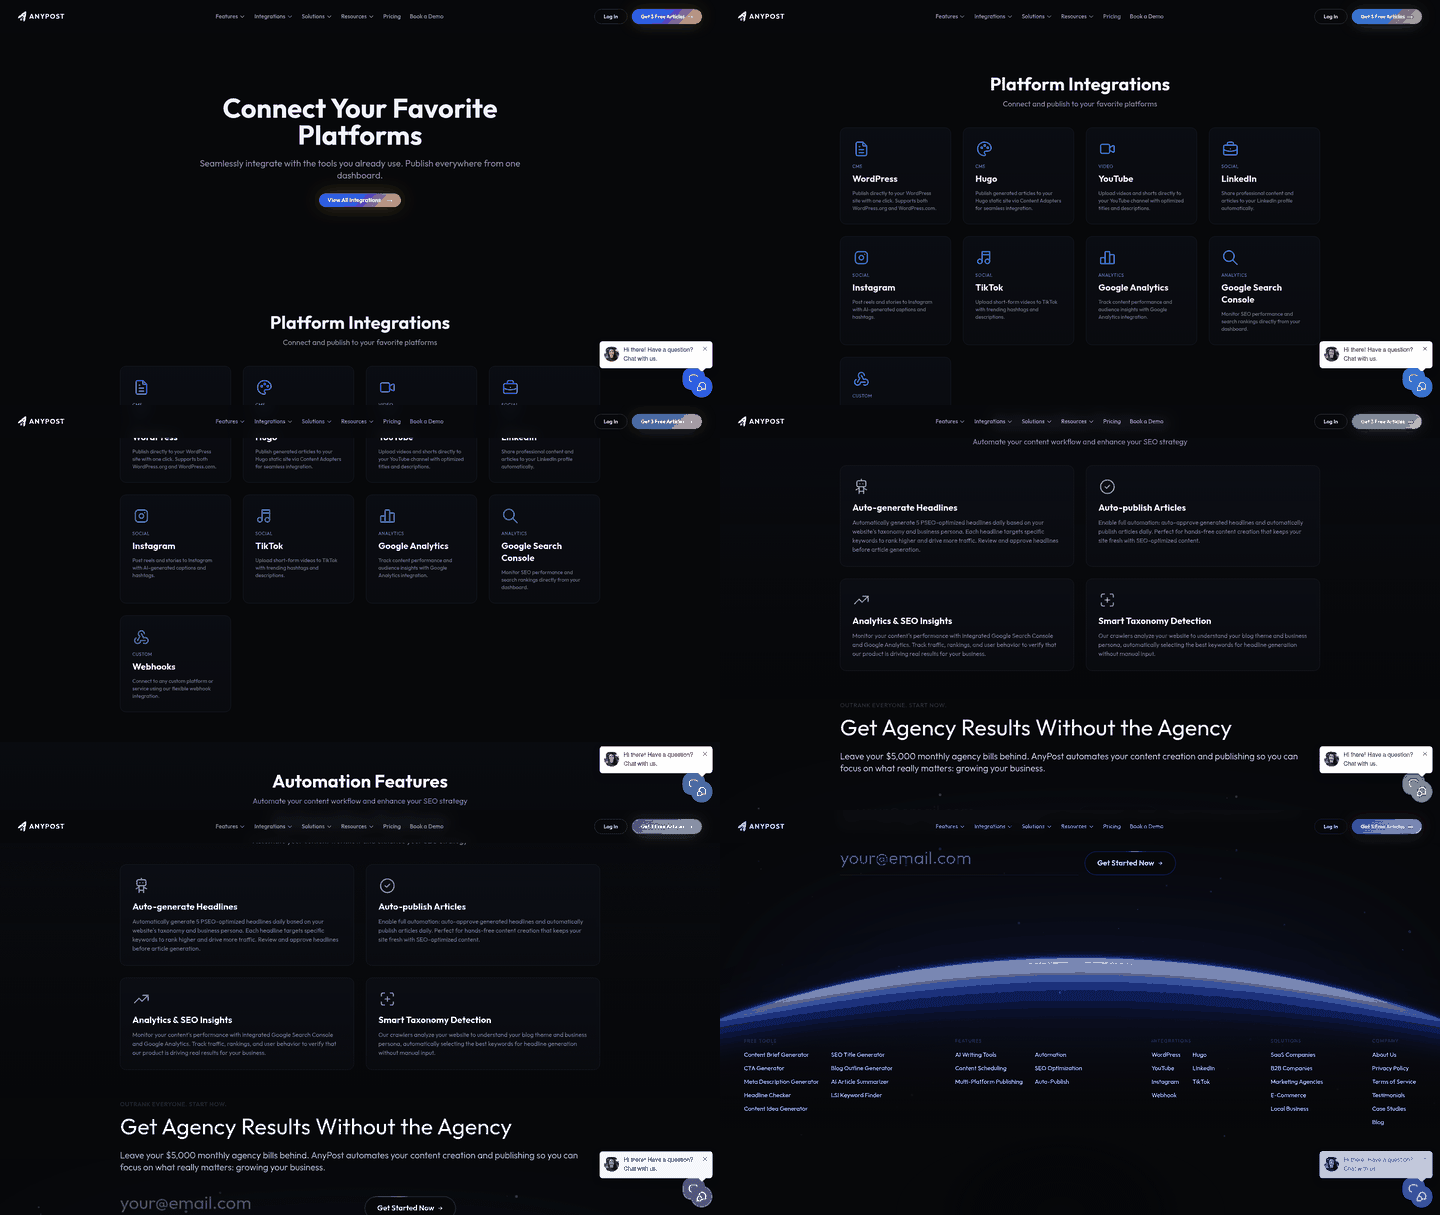
Connect Google Analytics, Google Search Console, and your CMS, and you get one data flow instead of three. Pull traffic, impressions, and crawl data into a single dashboard, and the team sees a draft's performance the instant it publishes, then applies updates from the same interface. No more insights that turn into action three days too late.
A multi-source feed isn't optional here, because today's SERPs are full of zero-click answers and AI snippets. Over half of mobile searches now end in no click at all, and AI outputs can eat into traditional link clicks. Watching combined GA and GSC signals next to the page's content version is the only reliable way to know whether a piece is actually adding value.
Connecting Analytics and Search Console
Authenticate both APIs with a service account that has read-only access to the property.
- Create the service account in Google Cloud, grant it the "Analytics Viewer" and "Search Console Viewer" roles, then download the JSON key.
- Configure the data pull in your automation layer: a nightly job hits the Analytics Reporting API for sessions, users, and conversion events, while a parallel call to the Search Console API pulls impressions, clicks, and average position for the target URLs.
- Normalize timestamps to UTC and merge the two result sets on the URL key, producing one row per page that holds traffic, engagement, and SERP performance.
Run the job on a schedule that matches your publishing cadence, and the dashboard refreshes within minutes of a new draft going live.
A note on that service account: read-only access with scoped roles is doing real security work here. Don't hand automation a key with more permission than it needs to read a report.
Syncing your CMS with the reporting engine
Treat the CMS as the source of truth for which content version the dashboard should evaluate.
- Enable webhook notifications on the CMS (WordPress's "publish_post" hook, for example) that fire a POST to your integration endpoint whenever an article is created, updated, or republished.
- Attach the page ID from the webhook payload to the merged GA-GSC row, so the system knows which performance record belongs to which content version.
- Trigger a re-run of the KPI calculations right away, so the dashboard shows refreshed metrics next to the editable copy field.
That coupling lets an editor see how a headline change moved click-through rate while impressions held steady, the kind of thing that otherwise stays buried in two separate reports.
Keeping the data loop clean
Three guardrails stop the automation from turning into a data swamp:
- Validate schema on ingest – enforce required fields (URL, timestamp, metric names) and reject malformed rows before they hit the warehouse.
- Version-control content edits – store each CMS revision with a unique ID so the dashboard can compare performance across versions, not just the latest snapshot.
- Monitor zero-click trends – alert on sudden CTR drops that often signal an AI-driven SERP change, so you can pivot before traffic erodes.
Follow those and raw GA, GSC, and CMS signals become a living engine instead of a dashboard that slowly fills with garbage.
Selecting the Right Automated Reporting Tool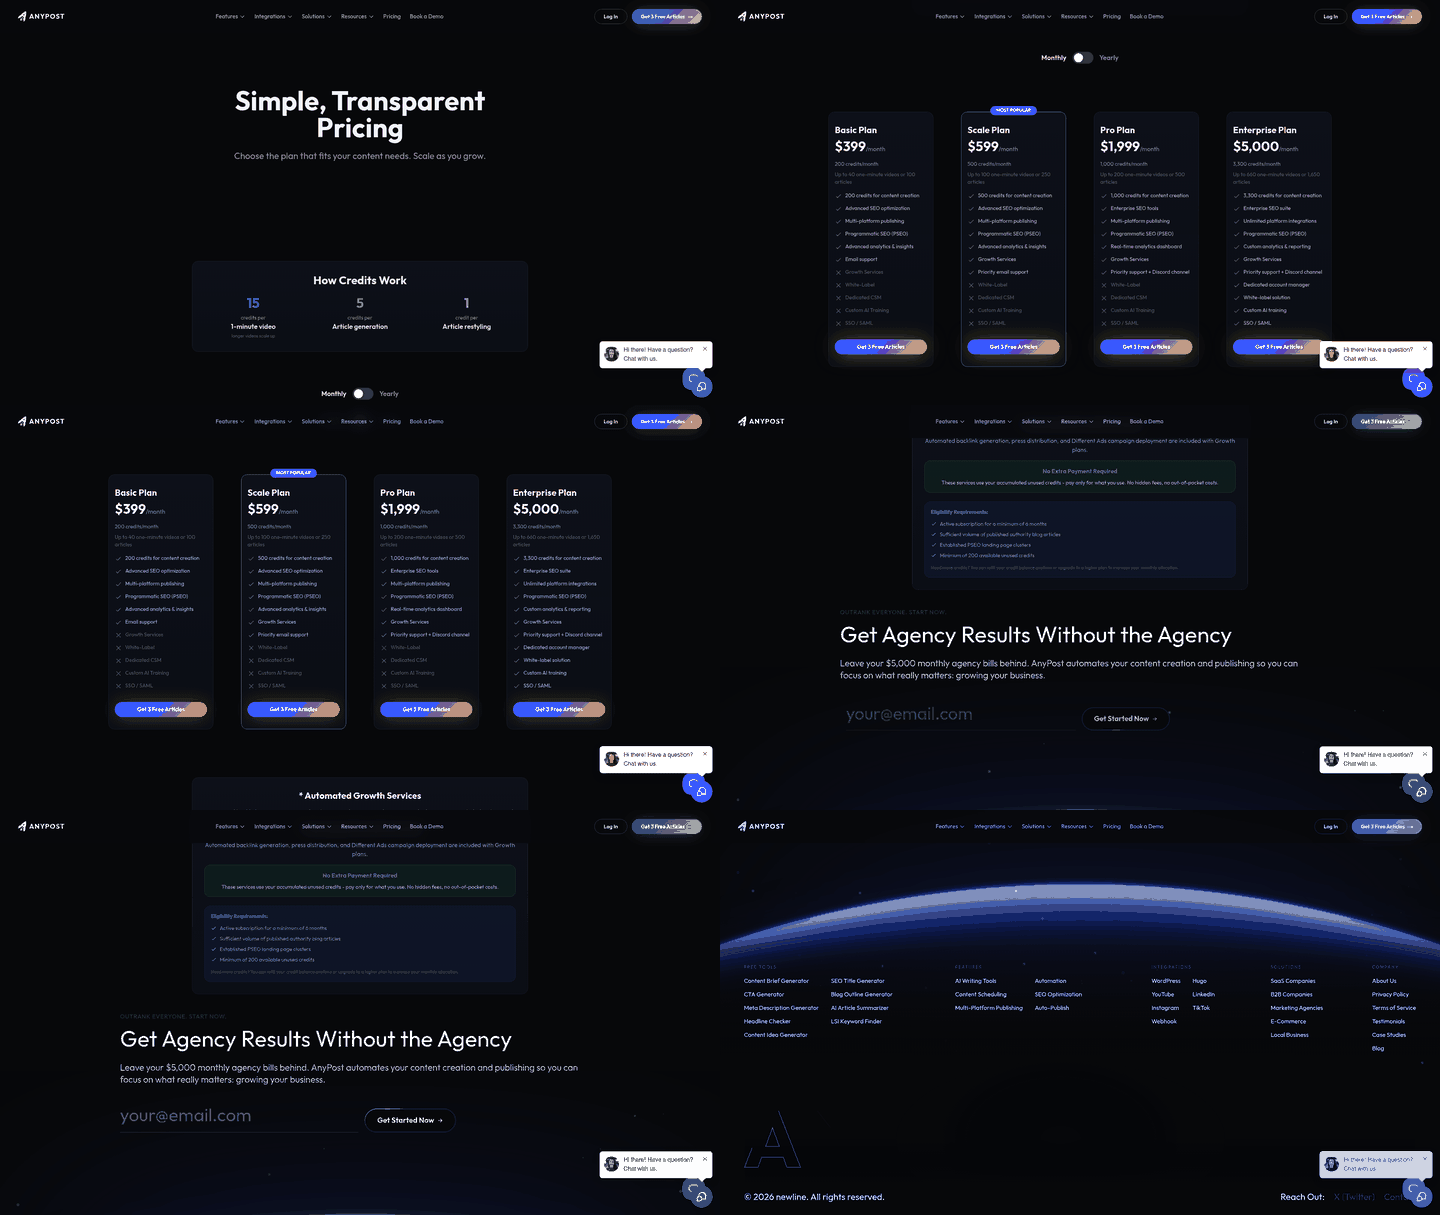
The tools worth paying for do three things: deep data ingestion, role-based dashboards, and content-edit hooks that actually close the loop.
Check that the platform pulls Google Analytics, Search Console, and your CMS into a single view. Check for role-based views so marketers, analysts, and execs each see what matters to them. And check for an in-place editor or API trigger that lets you tweak copy and push updates from the dashboard. Miss any of those layers, and you're back in spreadsheets, which breaks the whole closed-loop promise.
Cost versus scalability
Match the pricing model to how many pages you manage and how often you update them.
Look at whether pricing scales with page count and data sources. A team shipping hundreds of AI-drafts a week will watch a per-page or per-report fee blow past a flat license fast. A smaller shop might prefer pay-as-you-go so it isn't paying for capacity it never uses. A rough ROI check helps: (estimated labor saved × analyst hourly rate) minus subscription cost. If that's negative, the tool doesn't justify itself yet.
The three features that make the loop real
Real-time metrics, automated technical health checks, and one-click republishing. That's the shortlist.
- Real-time metrics – dashboards should update as soon as Google surfaces new impressions or rankings, so you're reacting to now, not last week.
- Automated technical health – built-in crawl reports, schema validation, and continuous site-health monitoring so the system can suggest meta-tag fixes or catch broken markup on its own.
- Direct CMS sync – an API or UI button that pushes the edited draft back to the live site and refreshes the reporting view.
Quick evaluation checklist
- Does the tool ingest GA, GSC, and CMS data automatically?
- Are dashboards role-based and executive-ready?
- Can you edit and update content straight from the reporting screen?
- Is pricing tied to usage instead of a flat, oversized license?
For a deeper look at vendors, see our guide on 7 automated reporting tools for marketing agencies in 2026. Weigh a tool against these criteria, and you end up with a continuous optimization cycle, not another siloed report gathering dust.
Best Practices for Data-Driven SEO Reporting
The approach that works: pair AI-generated drafts with AnyPost's built-in analytics so the team reviews performance, refines copy, and publishes without a handoff. Use the reporting layer as a decision point, and you cut the delay between insight and action that drags down traditional monthly reviews.
Once a page is live, the system captures impressions, click-through trends, and crawl health automatically, giving early visibility into how it's doing. That timely feed is what lets an editor spot a visibility drop, rework a headline, and push the update from the same interface.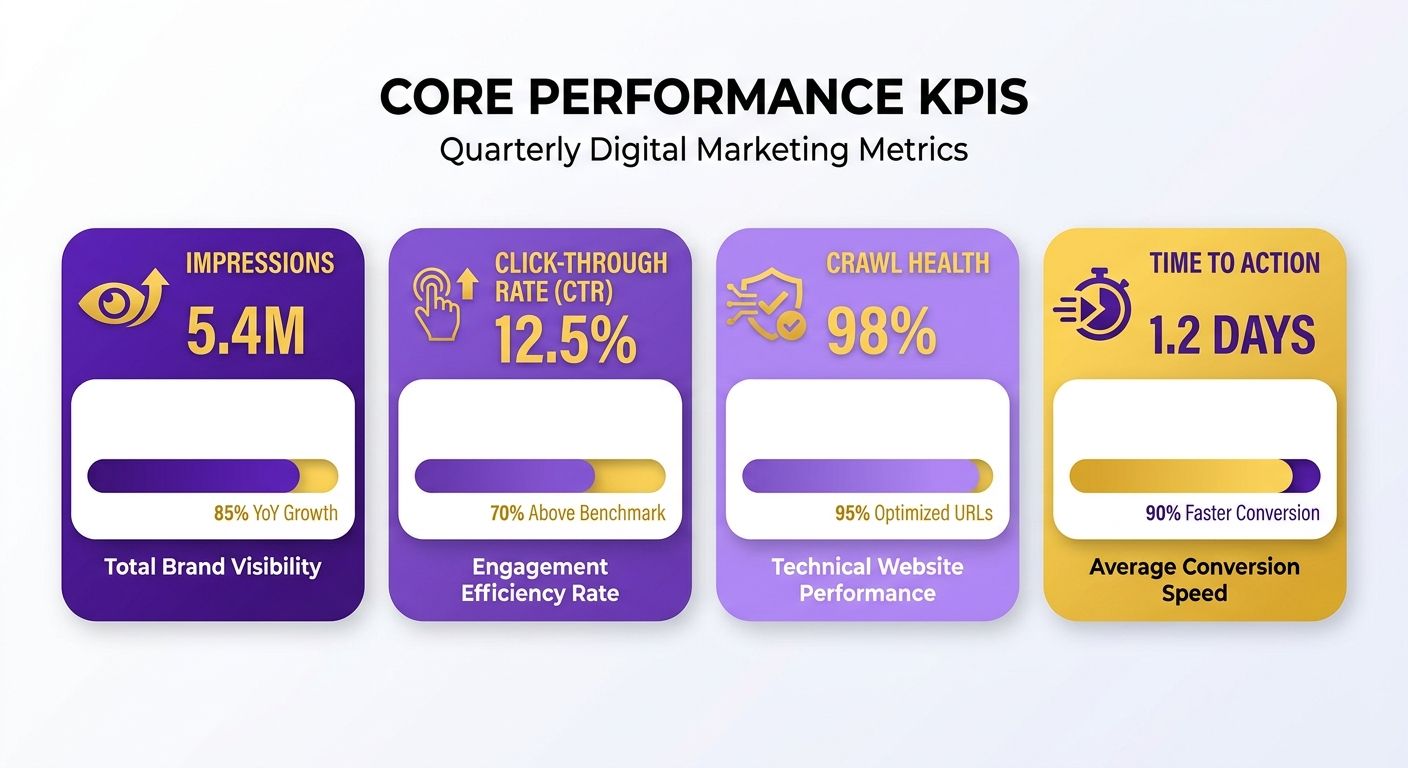
How AnyPost supports SEO reporting
AnyPost pulls signals from its AI engine and analytics into one view. Every generated article links to its performance data, and metrics like rankings, engagement rates, and schema validation get normalized into a shared model. Actionable KPIs surface on customizable cards, and the editing tools let writers adjust meta tags or add FAQ blocks from the same screen. Updating a page automatically triggers a fresh crawl, so the analytics stay current.
- Integrates with Google Search Console, Google Analytics, and supported CMSs to collect performance data.
- Ties each metric to its matching AI-generated article for easy reference.
- Offers role-based widgets: analysts get trend lines, creators get edit shortcuts, execs get revenue-aligned summaries.
- Lets you modify and update content directly, which kicks off a fresh crawl and refreshed analytics.
Presenting insights to stakeholders without the data dump
Distill the raw numbers into a snapshot that answers one business question: what is this content doing for our goals? A one-page view with three sections does it: (1) Performance Overview – traffic, rankings, zero-click visibility; (2) Action Items – alerts with recommended copy tweaks; (3) Outcome Forecast – projected lift based on past patterns. Bold headings and simple bar charts let leadership read ROI in seconds, and technical folks can still drill into the logs.
"AI doesn't replace SEO teams, it just makes them look good." – Saphia Lanier
Anchor every visual to a clear recommendation, and you skip the data-dump trap that loses non-technical stakeholders halfway through.
Turning dashboard signals into strategy
Treat each alert as a hypothesis for the next content sprint. When the dashboard flags a high-impression keyword with a low click-through rate, run a quick A/B test: rewrite the meta description, add structured data, and watch the change over time. Over a few weeks you build a playbook of which signals turn into traffic, then feed that back into the AI prompt library for future drafts.
A mid-size e-commerce brand watched "zero-click" SERP impressions climb for product-type queries. The read was to add FAQ schema to their top-ranking pages. After they did, featured-snippet presence lifted measurably, and the next reporting cycle captured it as a new KPI trend.
Unified ingestion, actionable dashboard design, stakeholder-centric storytelling, hypothesis-driven iteration. Get those four right and automated SEO reporting stops being a static report and starts being the engine that decides what you publish next.
Frequently Asked Questions
1. What happens if the Search Console API connection drops?
If the Search Console API becomes unavailable, the platform switches to cached data mode and sends an email alert to the admin. Users can manually upload a CSV export for the affected period, after which the dashboard refreshes automatically. This ensures reporting continuity while the connection is restored.
2. Can the automated reporting dashboard handle multilingual sites?
Automated reporting can segment metrics by language code and country, allowing separate rank and traffic views for each locale. AnyPost’s integration maps each article’s hreflang tags to the dashboard, so editors see regional performance and can prioritize translations without building extra reports.
3. How should I configure alert thresholds to avoid noise from minor fluctuations?
Set alerts to trigger only when a metric moves beyond a defined percentage or absolute threshold for two consecutive reporting periods. For example, require a 15 % drop in organic traffic lasting at least 48 hours before notifying the team, which filters out normal daily variance.
4. Is it possible to bring CRM‑derived lead or revenue data into the SEO dashboard?
You can pull lead counts or revenue figures from a CRM via its API and display them alongside SEO KPIs in a custom widget. This creates a single view that links keyword rankings to actual business outcomes, helping marketers justify content investments with measurable ROI.
5. What security steps are recommended when granting service‑account access to analytics data?
Grant the service account only Viewer roles for Analytics and Search Console, store its JSON key in a secret manager, and rotate the key every 90 days. Monitoring logs for unexpected calls adds an extra layer of protection, ensuring that data access remains tightly controlled.
6. How does this integrated reporting tool compare to building a custom Google Data Studio solution?
A custom Data Studio report offers unlimited visual flexibility but requires ongoing maintenance of data connectors and query limits. The automated platform provides built‑in refresh cycles, role‑based access, and one‑click republishing, reducing admin overhead. Choose Data Studio for highly tailored visuals, and the integrated tool for faster closed‑loop workflows.