Automated SEO Reporting: What to Track and How to Present It

I’m locating the article file and then I’ll tighten the copy without changing claims, links, or structure. After that I’ll do a quick pass for repeated phrasing and overlong sentences. I’m checking the workspace for the article source so I can edit the right markdown in place. I’m narrowing this down to the markdown file that contains the header image and FAQ sections. I’m listing markdown files now to find the exact article. I haven’t found the file yet, so I’m searching for a distinctive phrase from the article body. I’m searching for the “Key Takeaways” block to identify the source document quickly. I’m identifying the exact file before editing so I can preserve the markdown structure precisely.

Key Takeaways
- Automated SEO reporting combines keyword rankings, traffic, technical health, and backlinks in one dashboard. It replaces scattered tabs.
- Agencies report saving about eight hours a week by replacing spreadsheet reporting. That also cuts copy-paste mistakes.
- The most useful metrics are keyword rank trends, organic sessions, technical alerts, and AI-search signals like semantic relevance scores.
- Google Search Console and Google Analytics usually serve as the main feeds. Third-party backlink data fills the gaps.
- A dashboard that flags a 34% traffic drop can point to a technical issue quickly. A static PDF only shows the decline.
- Setup for a mid-size agency runs four to six hours. After that, it mostly runs on its own.
Quick Summary
An automated SEO report helps prove ROI without spreadsheets. It pulls keyword rankings, organic traffic, technical health, and backlink data into one live dashboard. That cuts manual work and reduces transcription mistakes. The result is a clearer story you can share when a new article goes live.
What metrics should your automated SEO report track?
A strong report covers keyword performance, search visibility, top-page traffic, technical issues, and backlink health. It should also include newer AI-search visibility signals.
Start with keyword rank trends and organic sessions. They connect directly to traffic growth. Add technical SEO alerts, crawl errors, and indexation gaps next. They help you catch problems before rankings fall. Finish with AI-search metrics like semantic relevance scores. Many agencies now treat them as part of modern SERP tracking. Those metrics give you a full view in one place.
"Automated reporting saves time, reduces errors, and makes SEO performance easier to review." - What Is Automated SEO Reporting and How Does It Work?
In practice, we use Google Search Console and Google Analytics as the main feeds. Then we add backlink data from a trusted provider. When the dashboard flags an unexpected drop, we can trace it to a technical cause. A static PDF would hide that link. Immediate impact and long-term health stay side by side.
How much setup does this actually take?
Configuration is quick. After that, it runs on a schedule with little upkeep.
We start with the most stable data sources, organic traffic and keyword ranks. They are predictable and useful right away. Once those are live, we add secondary modules like technical audits and AI visibility in two-hour chunks. Each one gets tested before we move on.
If your team runs fewer than ten active campaigns, a full dashboard may cost more than it saves. A spreadsheet can handle a low-volume site. For larger operations, the saved time can turn into billable work and fewer manual errors.
How do you keep the dashboard accurate and worth trusting?
Use constant validation and clear visual cues. That covers most of it.
We refresh keyword ranks daily and run technical audits weekly. That matches the cadence many SEO teams already use. Live dashboards, like those built in Google Data Studio, pull from over 1,000 data sources automatically. That keeps the numbers current without manual exports. For scheduled PDFs, we use a report builder that applies branding and flags key changes with color-coded alerts.
The payoff grows over time. Saved hours let analysts focus on strategy. A consistent visual format also builds client trust. That consistency helps in stakeholder meetings.
Line up metric selection, setup effort, and ongoing validation, and the automated SEO report stops being a data dump. It becomes a way to show the value of AI-generated content, brand alignment, and SEO impact in one place.
Why bother automating your reporting at all
It combines rankings, traffic, technical health, and search insights. That makes before-and-after comparisons much easier.
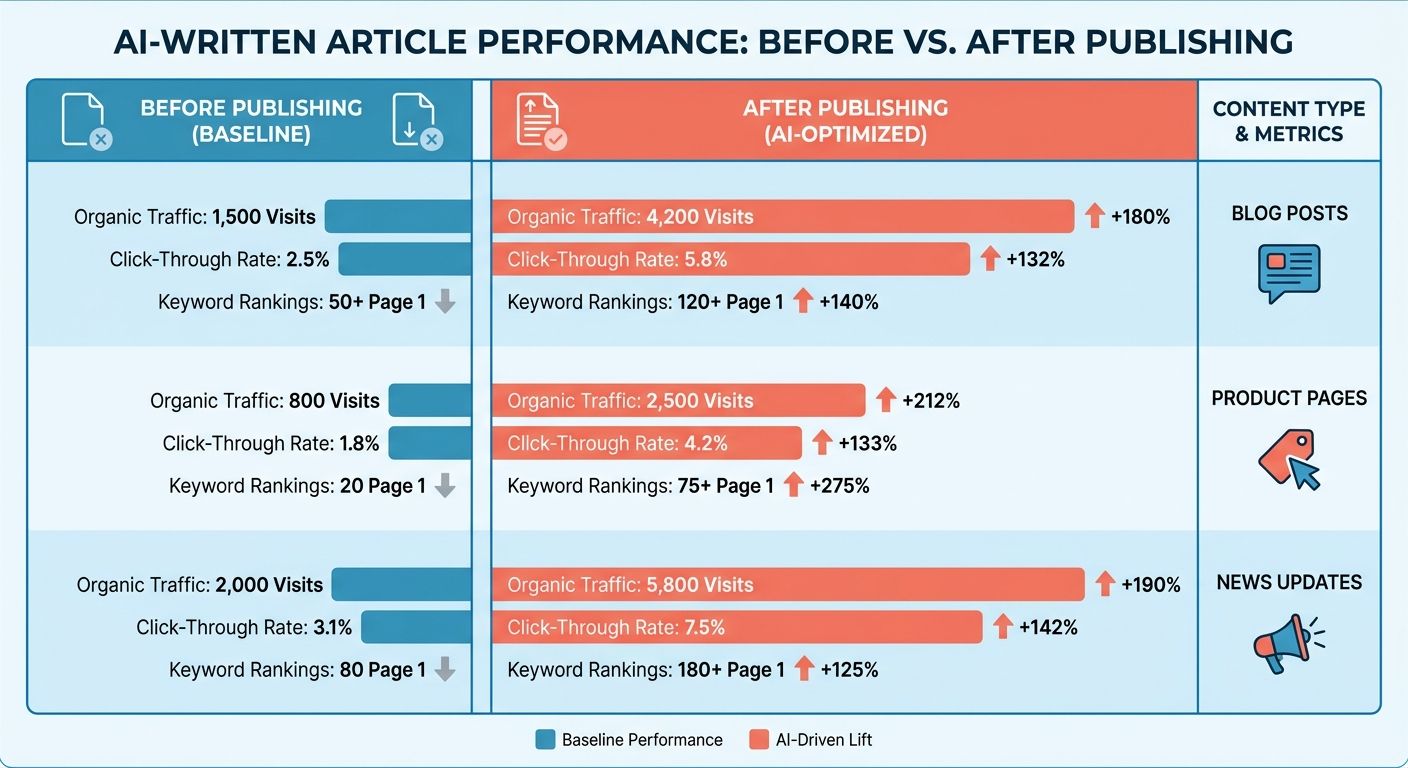
When a new AI-written article goes live, the report shows traffic trends after publishing. You can watch the lift over the next few weeks. You can also sort performance by content type. That helps identify which topics and formats drive stronger click-through rates. For executives, it gives clean proof that is easy to share.
What does automation actually save you from?
Mostly manual export errors. It also catches technical issues that can slip past a busy team.
Automation reduces spreadsheet mistakes and surfaces technical alerts, crawl errors, and indexing issues before they hit traffic. That matters more with AI-generated content, which can introduce new schema or dynamic URLs that a traditional audit might miss.
Skip it if your site only has a handful of static pages. Setting up APIs is not worth the small gain.
Which teams get the biggest lift?
B2B marketers, content creators, and growth leaders gain the most. They need to connect AI output to business goals.
The unified view helps marketers track conversion-linked keywords, creators watch brand tone, and growth leaders read overall search visibility. When teams stop assembling data by hand, they can iterate faster and spend budget where it matters.
Pull those signals into one automated SEO report and decision-makers get what they need to defend budget, refine strategy, and grow organic revenue.
The core metrics worth tracking
We watch average position, search-volume-weighted rank changes, and click-through rate. Those three show whether AI-written headlines and copy are landing with real users.
- Average position shows where a page sits in the SERPs. A steady climb suggests the content matches intent.
- Search volume helps weight rank changes. A gain on a high-volume term means the content is building authority.
- CTR shows whether the generated title and description earn clicks. It also reflects brand alignment.
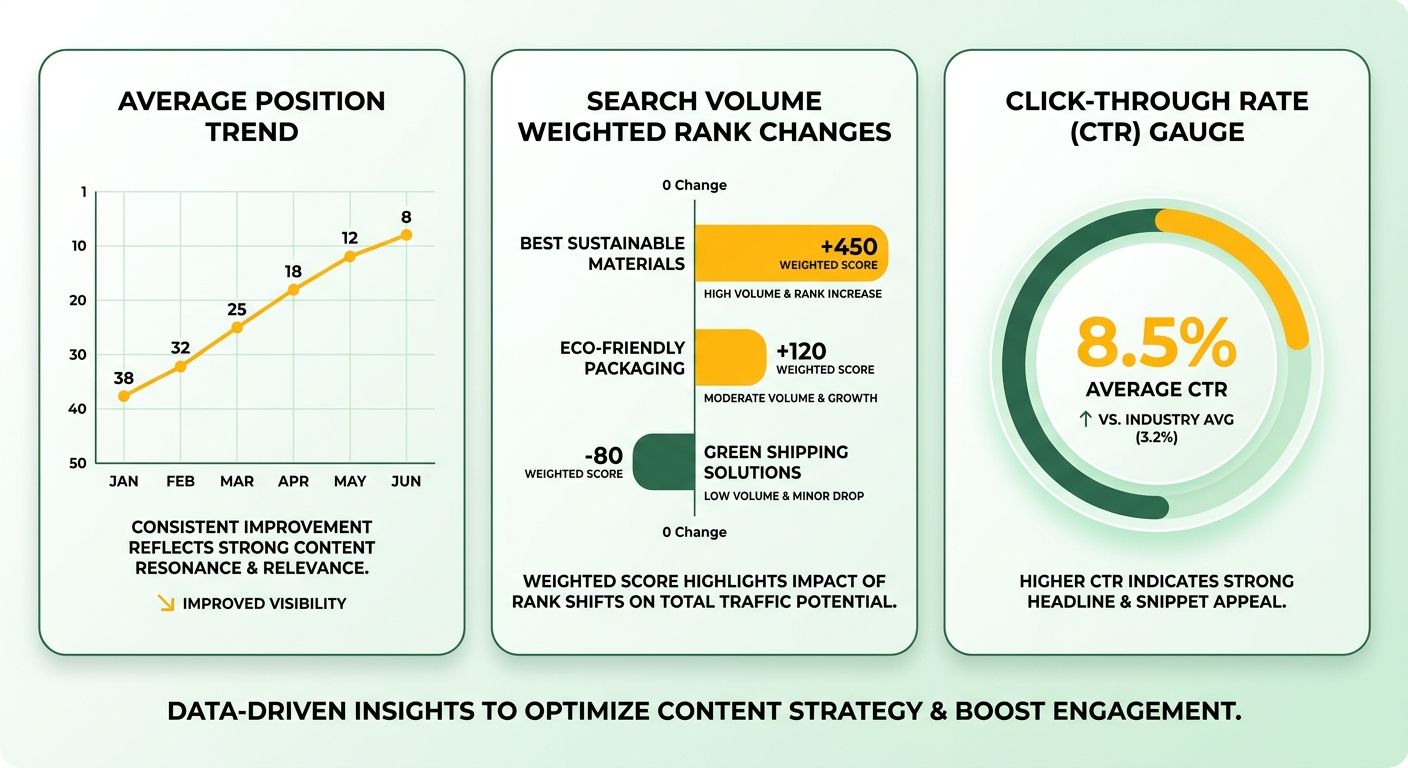
The dashboard updates rankings continuously, so unusual movements do not go unnoticed. If a page drops in position while traffic stays steady, review the prompt or the content behind it.
How do you measure organic traffic impact?
Track clicks, impressions, conversion rate, and bounce rate together. Each one alone can mislead. Together they show whether AI content drives useful visits.
- Clicks and impressions from Search Console show visibility and interest.
- Conversion rate connects traffic to outcomes. That is the clearest ROI signal.
- Bounce rate and average session duration show relevance and engagement. They also flag tone mismatches.
Watch these while a campaign is live, and you can react to shifts instead of writing a post-mortem.
"Numbers without context don't explain much; comparisons and benchmarks are essential." - Digital Marketing Reporting: Complete Guide With Examples
Which visibility and technical health metrics belong on the dashboard?
Search-visibility aggregates, top-page performance, technical alerts, and backlink equity belong together. They help keep AI output indexable and trusted.
- Search visibility combines impressions and average position. A dip can point to crawl issues or thin content.
- Top pages show which AI-generated assets bring the most traffic. That helps guide the next round of prompt tuning.
- Technical issues like crawl errors and mobile-usability warnings should be flagged automatically. Unresolved bugs can erase content gains.
- Backlink profile metrics like domain authority and link equity show external endorsement. That matters for AI-created pages too.
We put these into one view. That is standard reporting practice, not a special trick. It saves time and keeps the main KPIs in one place.
When should you drop a metric?
If your site publishes very little, deep backlink tracking may add noise. In that case, focus on keyword and traffic signals.
Cutting low-impact metrics keeps the dashboard clean. It also keeps attention on the data that drives ROI.
Choosing the right KPIs for your business
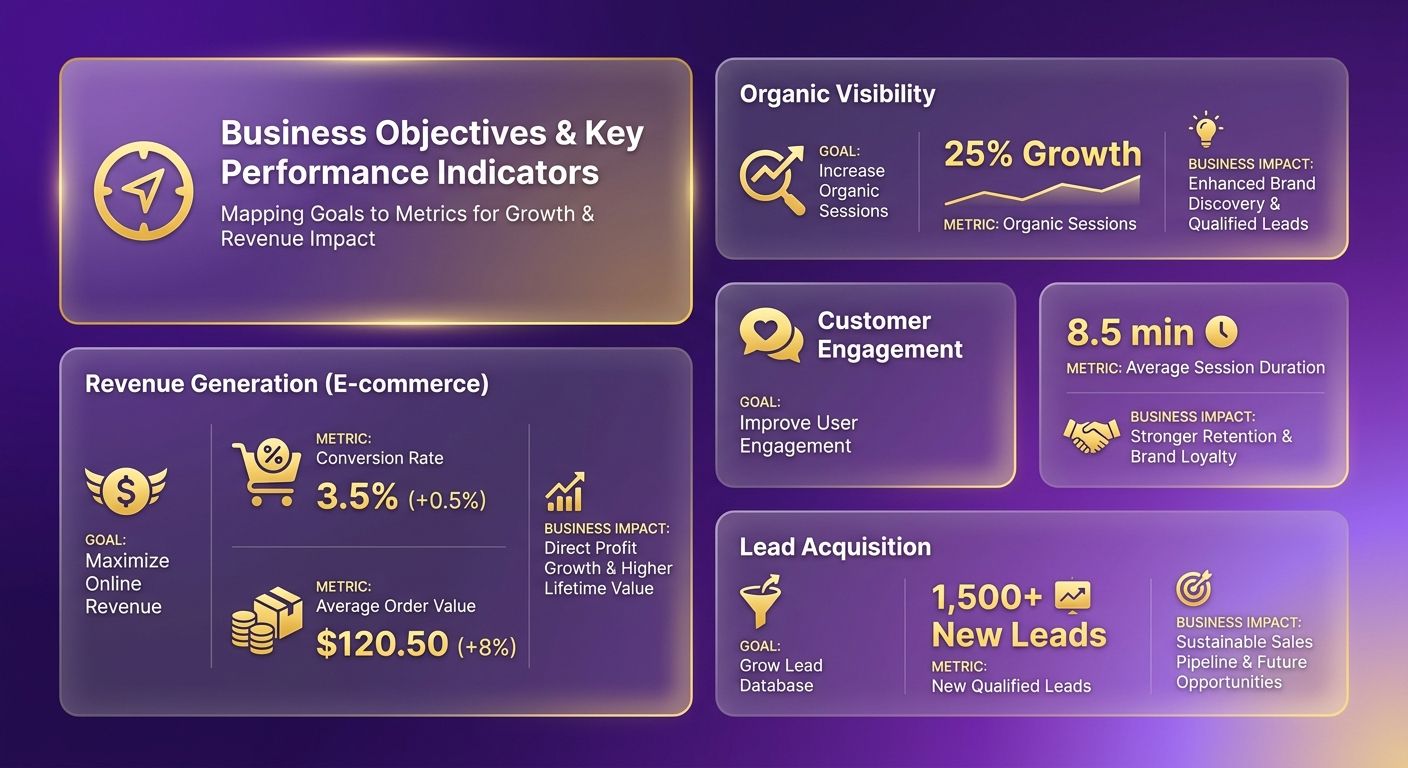
Your KPI set should match the goal that matters most. Every metric also needs to be something the report can capture. For a content-driven site, we lead with organic sessions, keyword rank velocity, and click-through rate. They track audience interest directly. For e-commerce, add conversion rate and average order value to tie SEO back to revenue.
We map each objective to a specific metric the report can measure. Our Persona Engine surfaces the audience intent behind top-performing keywords. That helps keep the AI-generated voice on message. When it flags a gap between brand tone and search intent, we adjust prompts and watch rank position and CTR move. The loop stays tight, and content quality stays aligned with SEO impact.
How do you match KPIs to AI-content quality and SEO impact?
Pair real-time analytics with contextual benchmarks. That turns raw numbers into something usable. Daily refreshes help you catch ranking changes fast enough to act.
We layer technical health alerts like crawl errors and page speed on top of content signals like keyword density and meta-tag consistency. Including both in the report prevents isolated numbers from telling the wrong story. If a page's average position falls but traffic holds steady, the content still meets intent. In that case, fix the on-page experience instead of over-optimizing keywords.
You can also set custom thresholds for notable swings in organic sessions or CTR. That turns the report from a static snapshot into a decision tool.
When should you skip the hyper-granular dashboard?
If your site gets minimal organic traffic, or your team cannot act on daily alerts, a detailed dashboard can become noise. In that case, a weekly summary covering rankings, traffic, and conversions is enough.
Skipping granular monitoring on low-volume properties frees you up for higher-impact experiments like new AI prompts or topic clusters. When traffic grows, bring back the full KPI set to catch finer changes. Used that way, the report stays a strategic asset instead of a chore.
Designing the dashboard
We recommend a three-layer stack. Use an extraction layer for API pulls, a lightweight data store for history, and a visualization platform for the metrics.
- Extraction layer: Use the native APIs of your search console, analytics, and backlink services. They return structured JSON that AnyPost can ingest on whatever schedule you set.
- Data store: A cloud spreadsheet or a simple relational table works well. The point is versioned snapshots, so you can compare week over week.
- Visualization platform: Pick something that supports custom queries and live refreshes. Most modern dashboards do. That flexibility lets you add AI-specific fields, like "prompt similarity score," beside the standard SEO numbers.
Because the pipeline updates in real time, you can catch a dip in brand alignment as it happens. You do not have to wait for a Friday export.
How do you structure the visual layout?
Split the dashboard into four panels: traffic overview, ranking trends, AI-voice health, and technical health. One chart type per panel keeps it readable.
- Traffic overview: Use a line chart of organic sessions with a shaded area for AI-driven impressions. That helps line up traffic spikes with new content releases.
- Ranking trends: Use a bar-plus-scatter combo for average position and search-volume weight. It makes high-value keywords stand out.
- AI-voice health: Use a heatmap for pages where the generated tone drifts from your brand guide, from "on-brand" to "off-brand."
- Technical health: Use a table for crawl errors, page-speed warnings, and backlink quality scores, sorted by severity.
Consistent color palettes, clear axis labels, and hover tooltips turn raw numbers into a story. Add filters for date range, content type, or author, and executives can drill down without asking for a separate report.
When should you skip the fully automated dashboard?
If your site publishes little and your goals stop at baseline visibility, a custom dashboard may cost more than it returns.
- Small sites may be better off with a weekly email export. Use the setup time on content instead.
- Teams without in-house data engineers should weigh the learning curve of API connections against the expected ROI.
For larger operations, automating the workflow frees up time for analysis and strategy. That is where humans should spend it.
Customizing for business objectives
You can fold in metrics you already track, including token counts from generation logs and confidence indicators from your AI model. Then map them to existing KPI buckets.
- Define the metric in the extraction layer, for example by pulling token counts from AI generation logs.
- Create a calculated field in the visualization platform that normalizes it against traffic volume.
- Place the field in the AI-voice health panel with a threshold line that flags outliers.
Line these up with stakeholder goals and the dashboard becomes one source of truth for both SEO performance and AI-content quality. You do not need four reports to make the case.
What you actually get out of automating this
It removes manual data pulls, consolidates every KPI into one refreshable view, and gives you more time for strategy work.
AnyPost.ai connects directly to Google Search Console, Google Analytics, and backlink sources through native APIs. It then writes the results to a central dashboard so the latest numbers stay visible to the team.
Why does accuracy matter so much with AI-generated content?
Clean data is how you confirm whether the AI voice stays on brand and whether search signals respond.
When the report checks keyword rankings against expected performance, you can spot a mismatch between intended voice and actual user intent. A small CTR dip after a tone shift usually means the meta description no longer resonates. That is a cue to refine the prompt before traffic erodes. Because the dashboard reads straight from source APIs, the transcription errors common in manual spreadsheets never enter the picture.
"Automated reporting isn't about replacing human insight, it's about amplifying it so marketers can focus on strategy rather than spreadsheets." - industry observer
What deeper insight does this unlock for ROI?
It surfaces the trends and anomalies that support better budget decisions and faster growth.
Layer AI-driven visibility metrics on top of traditional SEO data, and the report shows which content formats generate the most organic sessions. That tells you what to make more of. Real-time alerts also catch technical issues early, so you can fix them before they hurt a quarterly goal.
A few things to build into your own dashboard
- Custom KPI mix - combine rank velocity, traffic, and brand-alignment metrics.
- Frequency choice - match update cadence to your traffic. Use daily for high-volume properties and weekly for evergreen content.
- Stakeholder view - generate a shareable snapshot after each major content rollout to show leadership the ROI.
If your team publishes very little, the overhead of a full automated report may outweigh the benefit. A spreadsheet can hold you over until volume grows. As that volume rises, the time savings, fewer errors, and sharper insight from an automated SEO report become more valuable. That matters especially for B2B marketers and growth leaders who need to keep proving the work pays off.
Frequently Asked Questions
1. How often should a low-traffic website refresh its automated SEO dashboard?
For low-traffic properties, a weekly data pull is usually enough. Daily updates add little value when traffic changes slowly. Schedule the keyword rank API to run every 24 hours, but cache the results and push them to the dashboard once a week to keep load low.
2. Can I rely on a free Google Data Studio template instead of a paid solution like AnyPost.ai?
A free Google Data Studio template can cover core SEO charts, but it lacks built-in API connectors and automated error handling. A paid platform like AnyPost.ai provides those pieces. If you have in-house technical resources, the free option can work. Otherwise, the subscription saves time and reduces maintenance overhead.
3. What security steps are required when linking APIs for automated SEO reporting?
Secure API connections need encrypted HTTPS endpoints, rotating access tokens, and least-privilege permissions for each data source. Store credentials in a secret manager instead of hard-coding them. Audit logs weekly to detect unauthorized calls. These steps help protect Google Search Console and analytics data.
4. How do I account for seasonal rank fluctuations in an automated report?
Treat seasonal rank swings as expected variance by adding a rolling 30-day average line to the ranking chart. Compare current positions against the same month from the previous year to isolate real performance shifts. Alerts should trigger only when the deviation exceeds a preset percentage beyond the seasonal baseline.
5. Is it advisable to mix paid-search data with organic metrics on the same SEO dashboard?
Paid-search metrics can sit on the same dashboard, but they need clear labels. Otherwise, stakeholders can get confused. Pull Google Ads impressions, cost-per-click, and conversion data into a separate panel. Use color coding to distinguish paid and organic performance. That keeps the insights separate while still allowing cross-channel analysis.
6. What common mistakes cause alert thresholds to become ineffective?
Setting alerts too low creates noise. Setting them too high hides real issues. Base thresholds on historical averages, then adjust by 10-15% to catch meaningful changes. Test alerts for a week before finalizing them, and always include a severity level so teams can prioritize response.
7. How can dashboard insights improve AI-generated content voice consistency?
When the AI-voice health panel flags a page as "off-brand," review the prompt template and adjust tone descriptors or keyword emphasis. Re-run the content through the generation model, then monitor the dashboard for CTR and bounce-rate improvements over the next 48 hours to confirm the fix.