
Build an Ahrefs Report Generator with DashThis and Automated SEO Reports

Quick Answers
- Automated Ahrefs reporting cuts monthly client reporting from hours to minutes, freeing teams for link outreach and competitive work.
- Static monthly exports can be stale by the time you send them.
- DashThis's Ahrefs connector ships with preset widgets, metrics, and a report template that carries the same layout forward each cycle.
- The connector tracks Domain Rating, referring domains, organic traffic, and keyword rankings by SERP position, including top-three and page-one slots.
- Native dashboard connectors authenticate through OAuth without extra API tiers.
- Use top-three and lower-ranking buckets with referring-domain diversity to decide next steps.
The part most teams underestimate isn't writing the content
Automated Ahrefs reporting cuts monthly client reporting from hours to minutes. Manual SEO reporting still swallows whole afternoons. A few hours per client, every month, adds up fast when you’re running multiple accounts. The reclaimed time goes to link outreach, content briefs, and the competitive work that actually moves rankings.
Stale data hits faster than most teams expect
Backlink indexes don’t stand still between client calls. A competitor picks up new links, a publisher removes a placement, or a newly earned citation starts influencing your campaign before the next manually prepared deck is due.
Automated dashboards pull fresh data on a schedule. Ranking shifts and backlink changes show up close to when they matter. That turns SEO reporting into a competitive intelligence layer instead of a historical record.
DashThis's Ahrefs connector offers quick setup
The integration includes ready-made components for common SEO metrics and a starter layout you can adapt. Setup friction is low. The connector authenticates quickly, and each new reporting period preserves the structure clients already recognize. That consistency matters because clients see the same dashboard organization month over month. It makes trend-spotting easier.
Agencies tend to organize Ahrefs dashboards into KPI summaries, trend charts, and tables. Referring domains often tell a clearer story than total backlink count. Diversity matters more than volume when you’re evaluating link-building momentum. Pairing Ahrefs with Google Ads data can also flag high-intent keywords where organic rankings could replace paid spend.
The real win is cumulative. When reporting no longer eats into production time, teams build better competitor scorecards, turn ranking gaps into content briefs, and spend more attention on the analysis Ahrefs makes possible.
Connecting Ahrefs to DashThis
Connecting Ahrefs to a dashboard platform takes manual exports out of the picture. The integration depends on account permissions: native dashboard connections use the platform’s authorization flow, while direct API builds require the right Ahrefs access level before production use.
Connecting through OAuth
Log into your dashboard platform and navigate to the integrations library. Select Ahrefs from the list of available connectors. The system prompts you to authorize access to your Ahrefs account. Click through the OAuth flow, confirm the domain or project, and the connector pulls your first data snapshot.
Once connected, the integration exposes core Ahrefs fields most teams use for client reporting: backlink authority, link growth, estimated search visibility, and ranking distribution. Separate priority keywords by visibility tier so clients can distinguish between terms already near the top of the results and terms that still need content or link support. Future reporting periods keep the same dashboard structure, so weekly or monthly reporting becomes a refresh task rather than a rebuild.
Verifying the initial data pull
After connection, confirm that the dashboard shows the expected Ahrefs assets. Check that the preset widgets are populated with live data from your target domain. Verify that metrics like backlinks, referring domains, and organic traffic match what you see inside the Ahrefs interface. If numbers diverge, the most common cause is a date-range mismatch—dashboards default to the last 30 days, while the Ahrefs interface may show a custom range.
For teams that need custom metrics unavailable in any native connector—average traffic per page, competitor scorecards that blend Ahrefs with external APIs, or backlink-acquisition velocity calculated from historical snapshots—the Ahrefs API offers direct access to endpoints including domain-rating, backlinks-stats, metrics, and pages-history. Those endpoints let you build competitor dashboards that calculate traffic-per-page ratios and monitor new competitor links as they enter the index.
The operational gain is straightforward: fewer repeated CSV downloads, fewer spreadsheet handoffs, and fewer opportunities for reporting errors. Across a full client roster, that gives agencies more room for high-value work around the report—diagnosing stalled outreach campaigns or turning keyword gaps into production-ready briefs.
Customizing Your DashThis SEO Dashboard
The fastest way to make the dashboard useful is to group widgets around the five SEO surfaces your clients actually care about, then use ranking buckets to decide what to build next. The starter assets give you enough structure to launch quickly, but the real efficiency gain shows up when you customize those widgets around the KPIs that matter most.
Grouping widgets around five core SEO surfaces
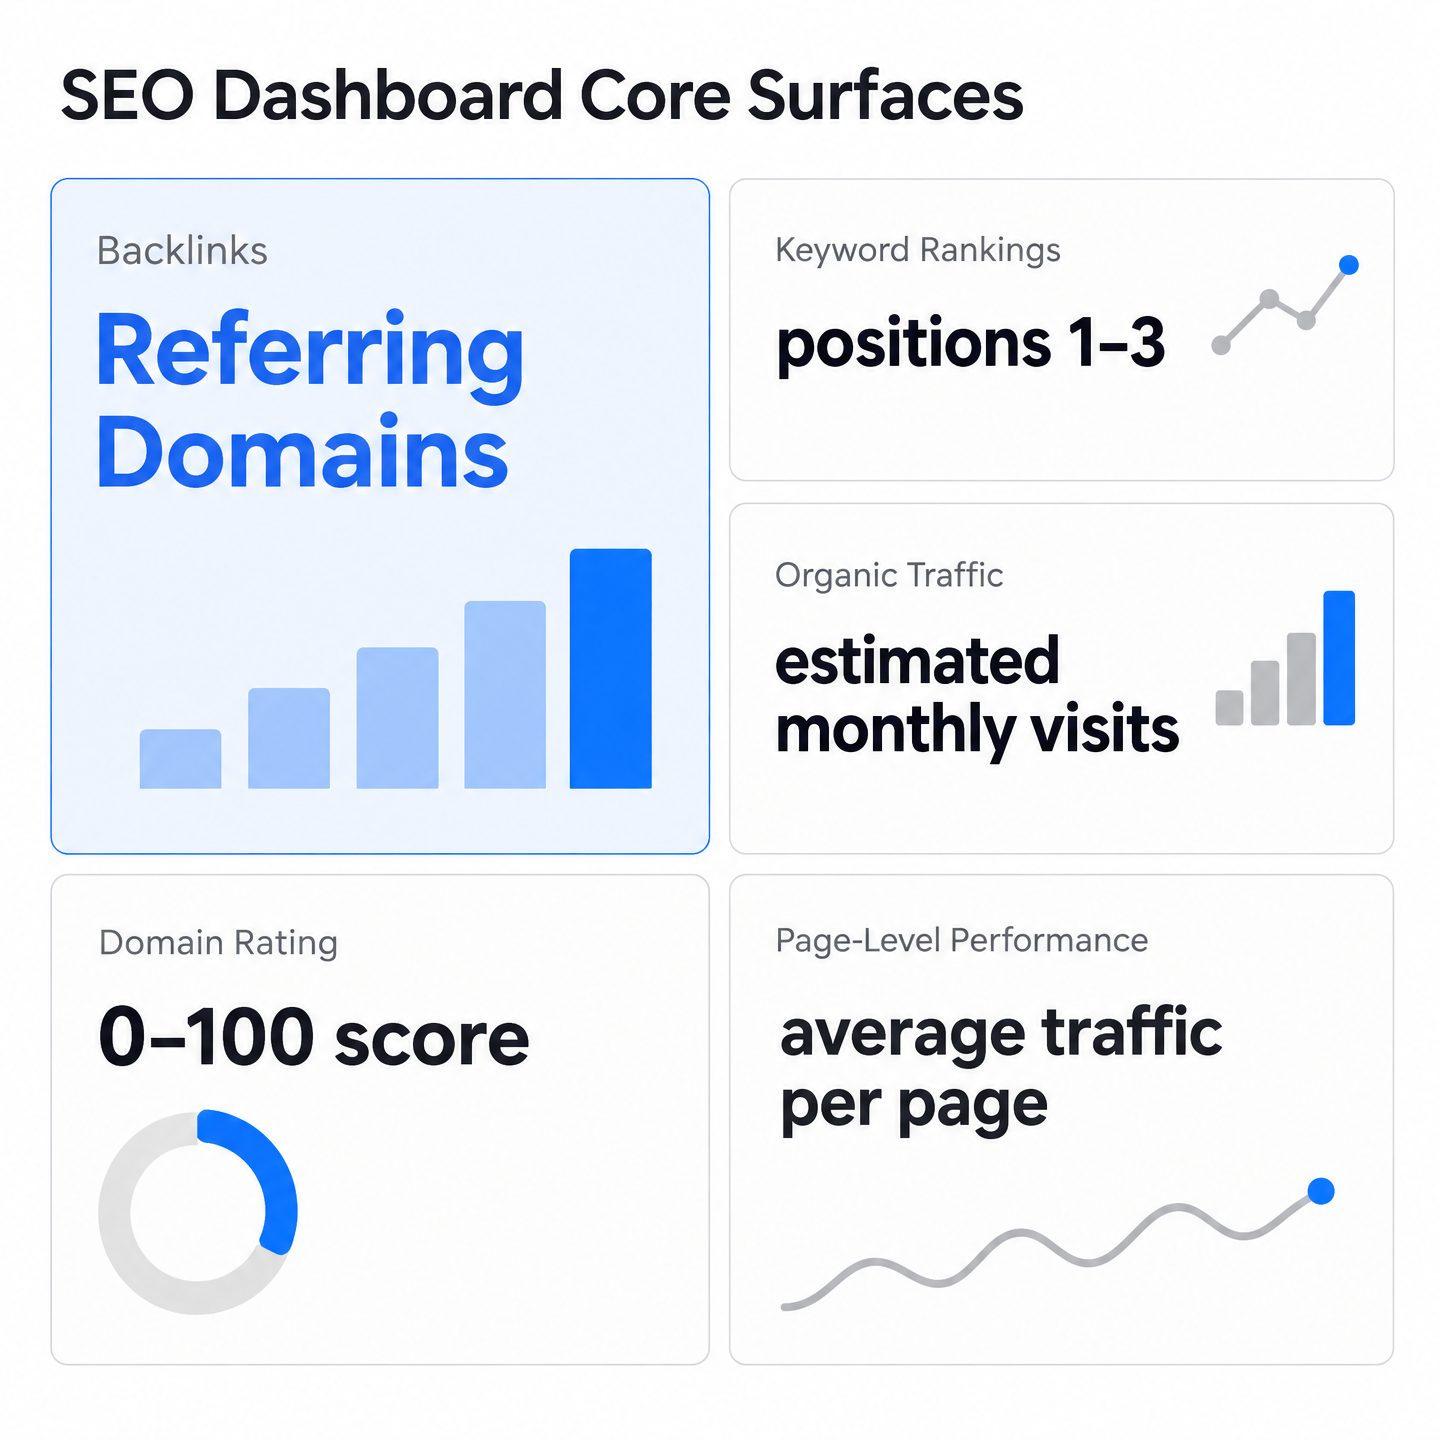
Most effective dashboards cluster around five sections: backlink profile, keyword rankings, organic traffic, domain authority, and page-level performance. Each section pulls from a different slice of the Ahrefs integration.
Domain Rating sits at the top. It gives clients a fast read on backlink profile strength because it behaves like a credit score for SEO. Pair that with Referring Domains and total Backlinks to show the breadth and depth of the link profile in one glance.
Keyword rankings need segmentation to be useful. Separate ranking-distribution widgets help clients see whether visibility is concentrated in high-performing terms or sitting just outside the most valuable positions. Use the top-three and lower-ranking buckets as a diagnostic lens, not just a status chart. If referring-domain diversity is flat while many keywords sit in lower buckets, the next move is usually link-worthy assets. If top-three coverage is decent but a cluster of keywords sits just below page one, the next move is usually content refreshes or volume.
Organic Traffic and Organic Pages round out the dashboard. Traffic shows estimated monthly visits; pages show how many URLs rank for at least one keyword. When you track both, you can create a cleaner competitor comparison than total traffic alone because it accounts for site structure differences and strips out brand-search volume distortion.
Filtering around position ranges and time windows
The platform supports filters based on the Ahrefs dimensions it imports. You can segment widgets by keyword visibility tiers and build side-by-side charts that show movement from lower-ranking groups into more valuable positions. That progression is often easier for clients to understand than a raw keyword table.
Date-range controls handle the time dimension. Set widgets to compare this month against last month, or overlay this quarter against the same quarter last year. Those comparisons surface seasonal patterns and let you isolate ranking gains that coincide with a link-building push or a technical audit.
The Ahrefs report template gives you a sensible starting layout, but don’t treat it as a duplication engine. Rearrange widgets and adjust metric groupings based on each client’s vertical. An e-commerce site cares more about Organic Pages because every product page is a potential ranking asset. A local service business watches Referring Domains more closely because their link-building strategy hinges on local citations and directory placements.
Those ranking and referring-domain signals become content-priority inputs: they show which pages to refresh, which keywords to support with new content, and whether the next brief should emphasize link-worthy assets or content volume. The dashboard should inform the brief; it should not be presented as an auto-publishing pipeline.
Automating Refreshes, Scheduling & Delivery
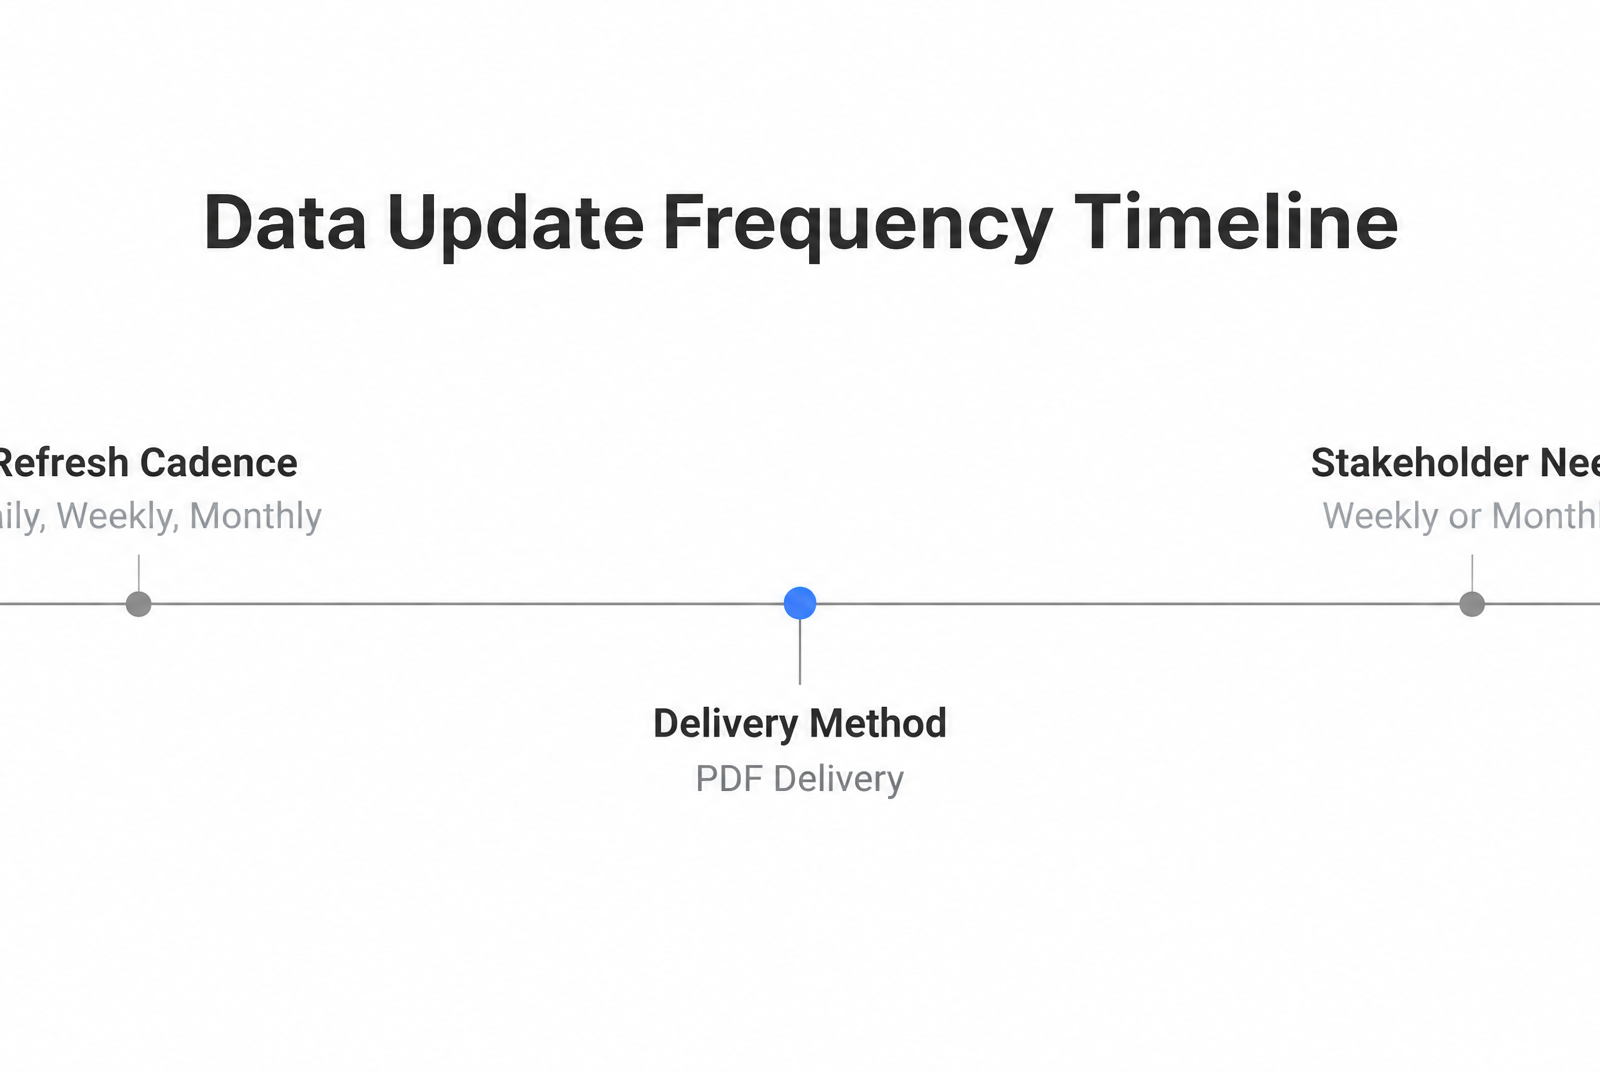
Set the refresh cadence to match how stakeholders use the information, not simply how often software can retrieve it. Automated reporting pulls Ahrefs data into a dashboard on a schedule and ships it without manual work. SEO work rarely changes direction every few hours, so reports should support planned cycles instead of creating noise.
Setting the refresh schedule that matches your workflow
The dashboard platform refreshes connected Ahrefs projects automatically. You choose the cadence when you build the dashboard, and the platform pulls updated metrics without further input. Because the dashboard structure carries forward, reporting becomes a recurring delivery process rather than a manual production sprint.
Ahrefs Report Builder also supports scheduled PDF delivery. That works well for stakeholders who prefer static summaries in their inbox rather than logging into a live dashboard. Scheduling controls let you decide when those reports land so they line up with client meetings, executive updates, or internal planning sessions.
Agencies often pair Ahrefs data with Google Search Console, Google Analytics, and social platforms to show how backlink gains correlate with impressions, traffic, and conversions. The dashboard platform supports native integrations with these tools, so you can surface those connections in a single dashboard rather than stitching together separate exports.
Adding an executive summary section to every automated report
A dashboard full of charts doesn’t guide decisions on its own. Add a short executive summary at the top of each report. Use three to four sentences that tie the month’s Ahrefs metrics to the content and outreach work the team prioritized. That summary answers the question stakeholders ask first: did the work move the needle?
The summary isn’t a product feature you toggle on. Write it once per reporting period, reference the widgets below it, and keep it concise. You might explain that a stronger referring-domain trend followed a guest-post campaign, then point readers to the traffic chart for the pages that received those links. That framing connects backlink activity to business-facing outcomes without forcing the client to interpret every widget on their own.
FAQ
1. Does the Ahrefs connector work with the standard paid Ahrefs plan, or do I need to upgrade to Enterprise?
For native connector users, authorization happens inside the dashboard workflow, so the connector is the simpler path. A custom API build is different: if you plan to query Ahrefs endpoints directly, confirm your Ahrefs access level before scoping the project.
2. How often should I schedule dashboard refreshes if Ahrefs updates its backlink database multiple times daily?
Match the cadence to your decision cycle. Agencies that review SEO performance during recurring client meetings usually benefit more from consistent scheduled reporting than from constant updates that no one acts on.
3. Can I calculate average traffic per page using the Ahrefs connector, or does that require a custom API build?
Yes. Use the connector’s traffic and page-count fields together, then create a calculated view that divides traffic by ranking pages. Reserve a custom API build for more advanced use cases, such as blended competitor scorecards or historical link-velocity tracking.
4. What's the practical difference between tracking total backlinks versus referring domains in a client dashboard?
Backlinks count individual links, while referring domains count the unique sites those links come from. In client reporting, the domain view is often more useful because it shows whether authority is coming from a wider set of sources or merely repeated links from the same places.