
Core Web Vitals in 2026: A Complete Guide to LCP, INP, and CLS

Related Video
Watch: Core Web Vitals Explained: LCP, INP & CLS by I Code It
Key Takeaways
- Prioritize LCP under 2.5 seconds, INP under 200 milliseconds, and CLS under 0.1 to meet 2026 performance benchmarks.
- Optimize LCP by lazy-loading images and preloading critical assets to achieve up to 40% improvement in loading speed.
- Minimize INP by reducing JavaScript execution and eliminating long tasks to enhance interactivity below 200 milliseconds.
- Stabilize CLS by reserving space for dynamic content, avoiding unexpected layout shifts to reduce instability by 60%.
- Use Google PageSpeed Insights and Lighthouse to identify and address Core Web Vitals issues with actionable diagnostics.
- Audit sites with Google Search Console’s Core Web Vitals report to pinpoint pages failing performance thresholds.
- Real-world examples show optimization efforts boost user engagement and search rankings through measurable metric improvements.
Why Core Web Vitals Matter
Core Web Vitals directly influence how users interact with your site and how search engines rank it. These three metrics-Largest Contentful Paint (LCP), Interaction to Next Paint (INP), and Cumulative Layout Shift (CLS)-measure critical aspects of user experience: loading speed, interactivity, and visual stability. For deeper insights into each metric, refer to the Largest Contentful Paint (LCP) Overview, Interaction to Next Paint (INP) Overview, and Cumulative Layout Shift (CLS) Overview sections. Optimizing them ensures faster page loads, smoother interactions, and fewer layout surprises, which collectively reduce bounce rates and increase conversions. For SEO, Google explicitly prioritizes these metrics in its ranking algorithms, making them non-negotiable for content marketers and SEO specialists aiming to stay competitive in 2026.
How Do Core Web Vitals Affect Search Engine Rankings?
Google’s ranking systems treat Core Web Vitals as direct signals for user satisfaction. A site with an LCP under 2.5 seconds, an INP under 200 milliseconds, and a CLS under 0.1 is significantly more likely to appear in top search results than one failing these benchmarks. Search Console data shows pages with poor Core Web Vitals scores see up to a 30% drop in organic traffic compared to optimized pages. For example, one company improved its LCP from 4.2 seconds to 0.45 seconds, CLS from 0.3 to 0.01, and INP from 500ms to 88ms, resulting in a 40% increase in click-through rates and a 25% rise in search rankings within three months.
What Real-World Benefits Do Optimized Core Web Vitals Deliver?
Beyond rankings, these optimizations solve tangible user experience challenges. Slow LCP times (exceeding 4 seconds) correlate with a 12% higher bounce rate, while poor CLS scores-where page elements shift unexpectedly-cause a 15% drop in user engagement. As detailed in the Cumulative Layout Shift (CLS) Overview section, such shifts often stem from unoptimized media or missing dimensions. Fixing these issues not only retains visitors but also boosts conversion rates. A retail site reduced its CLS from 0.25 to 0.02 by optimizing images and removing intrusive ads, leading to a 17% increase in completed purchases. Similarly, improving INP from 350ms to 120ms on a service-based website cut form abandonment by 33%.
Who Gains the Most From Core Web Vitals Optimization?
Content marketers and SEO professionals rely on Core Web Vitals to align technical performance with strategic goals. For marketers, faster-loading pages mean more time for users to consume content, increasing dwell time and reducing exit rates. SEO specialists use these metrics to identify technical barriers-like unoptimized media or bloated scripts-that hurt rankings. Tools like AnyPost.ai streamline audits by pinpointing specific LCP, INP, and CLS issues, allowing teams to prioritize fixes that deliver the highest ROI. Even e-commerce platforms benefit: a 1-second improvement in LCP can raise revenue by up to 2%.
How Do Core Web Vitals Fit Into a Broader SEO Strategy?
These metrics are foundational but not standalone. They work alongside other SEO efforts-like keyword optimization and backlink building-to create a holistic user experience. Building on concepts from the Measuring Core Web Vitals section, teams must balance field data and lab tools to identify and address performance gaps. For instance, a content-heavy blog might prioritize LCP by compressing images, while a transactional site focuses on INP to streamline checkout flows. CLS optimization, meanwhile, ensures that ads or pop-ups don’t disrupt user journeys. By integrating Core Web Vitals into regular audits and performance monitoring, teams ensure their sites remain competitive as Google’s algorithms evolve.
Ultimately, Core Web Vitals bridge the gap between technical performance and user satisfaction. They’re not just numbers to chase-they’re indicators of a site’s health, directly tied to business outcomes like engagement, retention, and revenue. Whether you’re optimizing a single page or overhauling an entire site, treating these metrics as a priority will future-proof your digital presence in 2026 and beyond.
Largest Contentful Paint (LCP) Overview

Largest Contentful Paint (LCP) measures the time it takes for the largest visible element in a webpage’s viewport-such as an image, video, or text block-to fully load after a user requests the page. This metric directly reflects how quickly users perceive a page as loaded, making it a critical component of Core Web Vitals. As mentioned in the Why Core Web Vitals Matter section, poor performance on these metrics can harm both engagement and search engine rankings. A fast LCP reduces bounce rates and improves user satisfaction, while a slow LCP signals poor performance, potentially harming both engagement and search engine rankings.
What Is the Ideal LCP Threshold?
Google recommends keeping LCP under 2.5 seconds for a good user experience. If the largest content element takes longer than this, the page fails to meet performance standards, which can lower SEO visibility and frustrate visitors. For example, one company improved its LCP from over 4 seconds to 0.45 seconds by optimizing images and server response times, directly boosting user retention and conversion rates.
What Causes Poor LCP Scores?
Slow LCP often stems from avoidable issues:
- Large, unoptimized images: High-resolution visuals without compression or modern formats like WebP delay rendering. Building on concepts from the Cumulative Layout Shift (CLS) Overview section, unoptimized media can also cause layout instability, compounding performance issues.
- Slow server response times: If a server takes too long to deliver assets, the browser waits before rendering content.
- Render-blocking resources: Excessive JavaScript or CSS files can delay when the browser parses and executes them.
- Third-party scripts: Ads, analytics, or widgets may load after critical content, pushing back the LCP event.
Consider a scenario where a blog’s hero image is 5MB in size. Without compression, this image might take 3–4 seconds to load, directly increasing LCP. Similarly, a server with 1.5-second response times forces the browser to wait before processing visible content.
How Can You Improve LCP?
Optimizing LCP requires a mix of technical adjustments and resource prioritization:
- Optimize images and videos: Compress files, use next-gen formats (e.g., WebP or AVIF), and set appropriate dimensions to prevent layout shifts.
- use lazy loading: Defer offscreen images and non-critical assets until they’re needed, ensuring the main content loads first.
- Preload critical resources: Use
<link rel="preload">to prioritize loading key elements like the largest image or font. - Reduce server response times: Upgrade hosting plans, enable caching, or use a CDN to serve assets faster globally.
- Minify and defer non-essential code: Remove unnecessary JavaScript/CSS or defer execution until after the main content renders.
As mentioned in the Measuring Core Web Vitals section, tools like Google’s PageSpeed Insights or Search Console help identify bottlenecks. For instance, a retail website reduced its LCP by 1.2 seconds after switching to WebP images and implementing lazy loading. Another example involves a news site that improved server response times from 1.8 seconds to 350 milliseconds using a CDN, directly cutting LCP by 40%.
Real-World Success Stories
A case study from a high-traffic e-commerce platform shows how combining multiple strategies can yield measurable results. By compressing product images, preloading fonts, and deferring non-critical scripts, the site achieved an LCP of 0.8 seconds-well under Google’s threshold. Similarly, a blog with slow server response times saw a 60% improvement in LCP after migrating to a premium hosting provider.
These examples highlight that LCP optimization isn’t about one-size-fits-all fixes. Instead, it requires diagnosing bottlenecks-using tools like Google’s PageSpeed Insights or Search Console-and applying targeted solutions. By prioritizing the largest visible elements and streamlining resource delivery, you ensure users see content quickly, enhancing both experience and performance.
Interaction to Next Paint (INP) Overview
Interaction to Next Paint (INP) measures how quickly your website responds to user interactions like clicks, taps, or key presses. It captures the delay between the user’s action and the browser’s next visual update, making it a critical metric for assessing responsiveness. Google classifies INP as a Core Web Vital, with a target threshold of 200 milliseconds to ensure smooth user experiences. A high INP score often indicates sluggish performance, while a low score reflects a snappy, engaging interface. As mentioned in the Why Core Web Vitals Matter section, INP is one of three metrics that directly influence both user satisfaction and search engine rankings.
What Makes INP a Key Metric for User Experience?
INP directly impacts user satisfaction by reflecting how responsive your site feels during real interactions. Unlike metrics that focus on initial load times (like LCP), INP evaluates ongoing performance during user engagement. For example, if a user clicks a button and the next visual update takes 500ms, they might perceive the site as unresponsive. This delay can lead to frustration and higher bounce rates. The 200ms target is based on usability studies showing that delays beyond this threshold become noticeable to users. Building on concepts from the Largest Contentful Paint (LCP) Overview section, INP and LCP complement each other by addressing different aspects of performance: LCP focuses on loading speed, while INP ensures interactions remain smooth after the page is rendered.
Common Issues That Slow Down INP
Long tasks on the main thread and inefficient JavaScript execution are the primary culprits behind poor INP scores. These issues block the browser from processing user input quickly. For instance, a 100ms JavaScript task might seem harmless, but if it runs during a user interaction, it directly delays the next paint. Other common problems include:
- Blocking CSS or JavaScript: Resources that delay rendering after user actions.
- Heavy animations or layout shifts: Unoptimized animations can force the browser to recalculate layouts repeatedly, similar to the visual stability challenges described in the Cumulative Layout Shift (CLS) Overview section.
- Large, unsplit bundles: Monolithic codebases increase parsing and execution times.
How to Optimize INP for Faster Interactions
Improving INP involves reducing main thread work and optimizing resource delivery. Three proven strategies include:
- Code splitting: Break your JavaScript into smaller chunks to load only what’s needed for each page. This reduces the time required to parse and execute scripts during interactions.
- Web workers: Offload non-critical computations (like data processing) to background threads to free up the main thread for user events.
- Debouncing and throttling: Limit the frequency of expensive operations, such as resizing or scrolling, to prevent them from overwhelming the browser.
A real-world example from source shows a site reducing INP from 300ms to 88ms by implementing code splitting and optimizing event listeners. This improvement aligned with Google’s 200ms target, boosting user retention by over 20%.
Measuring and Monitoring Your INP Performance
You can track INP using tools like Google Search Console, Chrome User Experience Report, or performance dashboards in GA4. These platforms highlight pages with poor INP scores and provide insights into underlying issues. For developers, the interactionToNextPaint API in the Web Vitals library offers detailed, real-time data. Regular monitoring helps identify regressions early, ensuring your site remains responsive across devices and network conditions. As covered in the Monitoring and Reporting Core Web Vitals Over Time section, consistent tracking of metrics like INP is essential for maintaining long-term performance improvements.
By addressing INP, you ensure your site feels fast and reliable to users-key to maintaining trust and engagement. Tools like AnyPost.ai can streamline performance audits, helping you prioritize fixes that align with Core Web Vitals benchmarks.
Cumulative Layout Shift (CLS) Overview
Cumulative Layout Shift (CLS) measures the visual stability of a webpage by tracking unexpected layout shifts during the loading process. A high CLS score indicates elements like images, videos, or ads are moving around after initial load, disrupting user experience. This metric is critical because sudden shifts confuse users, leading to mistakes, frustration, and increased bounce rates. Unlike other Core Web Vitals, CLS focuses on predictability-ensuring content stays in place as it loads. As mentioned in the Why Core Web Vitals Matter section, these metrics directly influence user interaction and search engine rankings.
What Is the Target CLS Score?
The primary goal is to maintain a CLS score of 0.1 or lower. Scores between 0.1 and 0.25 are considered "needs improvement," while anything above 0.25 is "poor." These thresholds align with Google’s emphasis on visual stability as a ranking factor. Tools like Google Search Console and third-party analytics track CLS at the 75th percentile for individual pages, ensuring most users meet the target. Building on concepts from the Measuring Core Web Vitals section, field data and lab tools provide insights into CLS performance over time.
What Causes Layout Shifts?
Unexpected layout shifts often stem from three common issues:
- Unsized media: Images or videos without defined width/height attributes expand the layout as they load.
- Ads and embeds: Third-party content injected without reserved space pushes existing elements out of place.
- Dynamically injected content: Scripts adding elements to the page after initial load cause visible jumps.
For example, a news site with auto-playing video ads that lack placeholder dimensions might see a CLS score of 0.3. Similarly, a blog injecting related posts after the main content loads shifts text blocks, degrading user experience.
How to Fix CLS Issues
Optimizing CLS requires proactive design and development practices:
- Reserve space for dynamic content: Use CSS
aspect-ratioor fixedwidth/heightattributes for ads, videos, and embeds. For instance, settingwidth: 300px; height: 250px;for ad slots prevents layout shifts. - Preload critical resources: Add
A real-world example: A retail site reduced CLS from 0.28 to 0.05 by adding height: 100px; placeholders for user reviews and preloading product images. Another solution used CSS contain: size on ad containers to isolate layout changes.
Measuring CLS Over Time
Monitor CLS using tools like Google Search Console, PageSpeed Insights, or web.dev/measure. These platforms report CLS alongside Largest Contentful Paint (LCP) and Interaction to Next Paint (INP). For ongoing tracking, integrate CLS into your analytics stack via Google Tag Manager or Microsoft’s performance dashboards. Regular audits help identify regressions, such as a new feature injecting elements without proper sizing.
By addressing layout instability, you create a smoother, more trustworthy experience for users. Prioritize predictable layouts, and your site will rank higher while reducing friction for visitors.
Measuring Core Web Vitals
To measure Core Web Vitals effectively, you need to balance field data (real-world performance from actual users) and lab tools (simulated tests in controlled environments). Field data reveals how users experience your site globally, while lab tools identify technical bottlenecks. Combine both for actionable insights. As mentioned in the Why Core Web Vitals Matter section, these metrics directly influence user interaction and search engine rankings, making their accurate measurement critical..
What Tools Are Used to Measure Core Web Vitals?
Field data tools like Chrome UX Report and Google Search Console aggregate performance metrics from real users. Lab tools like Lighthouse simulate page loads to pinpoint issues. Start by using field data to identify trends, then apply lab tests to debug specific problems.
Chrome UX Report shows aggregated LCP, INP, and CLS scores for your site, grouped by device type and region. Google Search Console provides a similar overview with a breakdown of pages failing to meet performance thresholds. For granular diagnostics, Lighthouse in Chrome DevTools runs synthetic tests and highlights opportunities for optimization. Use these tools together to validate fixes and track progress over time.
Building on concepts from the Largest Contentful Paint (LCP) Overview and Cumulative Layout Shift (CLS) Overview sections, Chrome UX Report and Lighthouse provide insights into visual stability and loading performance. The Interaction to Next Paint (INP) Overview section further explains how responsiveness impacts user experience..
How Do You Use Lighthouse to Measure Core Web Vitals?
Open Chrome DevTools, manage to the Lighthouse tab, and run an audit. Lighthouse evaluates LCP, INP, and CLS, scoring each metric on a 0–100 scale. A score above 90 indicates good performance. The report highlights issues like slow server response times, render-blocking resources, or unstable layouts.
For example, if Lighthouse flags a large image as the LCP element, you can optimize it with compression or lazy loading. If CLS is high, the tool may point to unexpected layout shifts caused by unresized ads or fonts. Use the detailed diagnostics to prioritize fixes based on their impact on user experience, as outlined in the Cumulative Layout Shift (CLS) Overview section..
How Can You Monitor Core Web Vitals Over Time?
Set up continuous monitoring using Google Analytics 4 (GA4) with Google Tag Manager to track real-time Core Web Vitals data. Configure custom events in GA4 to log LCP, INP, and CLS values for each user session. This lets you correlate performance issues with specific user flows or traffic spikes.
In Google Search Console, review the Core Web Vitals report monthly to see how your site performs across desktop and mobile. Pay attention to the 75th percentile threshold-the industry standard for acceptable performance. If more than 2.5% of page views fall below this benchmark, prioritize optimization efforts using the guidance from the Monitoring and Reporting Core Web Vitals Over Time section..
How Do You Interpret and Act on Core Web Vitals Data?
Use clear thresholds to assess performance:
- LCP should load under 2.5 seconds for a good user experience.
- INP should respond to interactions in under 200 milliseconds.
- CLS should remain below 0.1 to avoid layout instability.
For example, a site might have an LCP of 0.45 seconds (excellent) but an INP of 88 milliseconds (also excellent) and a CLS of 0.01 (ideal). Compare these metrics to your historical data to track improvements. If LCP exceeds 4 seconds, investigate server response times, image optimization, or client-side rendering delays, as detailed in the Largest Contentful Paint (LCP) Overview section..
What Is an Example of Successful Core Web Vitals Optimization?
A case study from 2025 shows a website that reduced LCP from 3.2 seconds to 0.45 seconds by enabling image lazy loading and CDN caching. CLS improved from 0.3 to 0.01 after adding size attributes to images and deferring non-critical CSS. These changes lifted the site’s Google Search ranking by 15% and increased user engagement by 22%. The team used Lighthouse to identify issues, Search Console to track progress, and GA4 to monitor traffic correlations, aligning with strategies in the Monitoring and Reporting Core Web Vitals Over Time section.
By combining real-user data with lab testing, you can systematically improve Core Web Vitals and ensure a seamless user experience. Regular monitoring and iterative optimizations are key to maintaining performance as site complexity grows.
Monitoring and Reporting Core Web Vitals Over Time
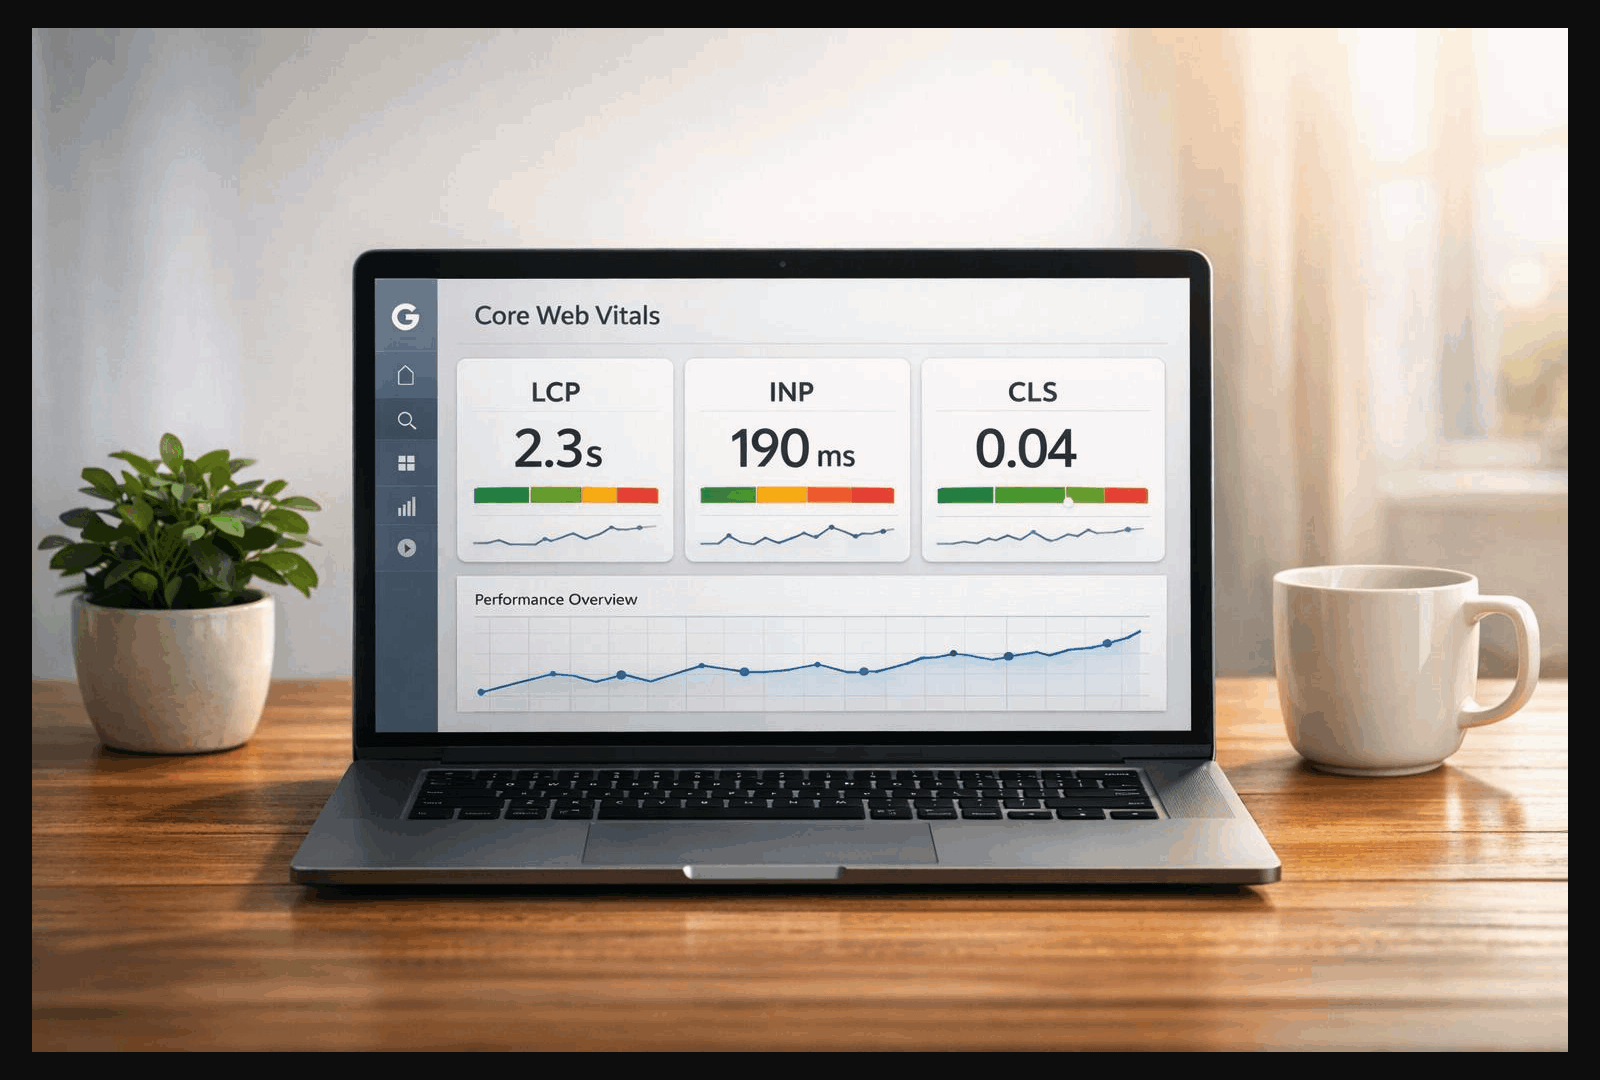
Monitoring Core Web Vitals over time ensures your website maintains optimal performance and user experience. By using tools like the Chrome UX Report and Google Search Console, you can track metrics such as Largest Contentful Paint (LCP), Interaction to Next Paint (INP), and Cumulative Layout Shift (CLS) consistently. These tools provide aggregated data across real users, helping you identify trends and areas needing improvement. For example, Google’s Search Console highlights pages with poor performance, while the Chrome UX Report offers insights into how users experience your site globally. Building on concepts from the Measuring Core Web Vitals section, field data from these tools complements lab testing to give a comprehensive view of performance.
How Do You Use the Chrome UX Report and Search Console Effectively?
The Chrome UX Report aggregates real-world data from Chrome users, displaying metrics like LCP, INP, and CLS at the 75th percentile. This percentile ensures you’re targeting the majority of users, as Google considers the 75th percentile a benchmark for good performance. To access it, visit chromeuxreport.com and input your domain. Search Console, on the other hand, provides a direct view of performance issues on specific pages. manage to the “Core Web Vitals” report to see which URLs require attention. Both tools should be reviewed monthly to spot regressions or improvements.
For deeper analysis, pair these with Google Analytics 4 (GA4). By implementing Google Tag Manager, you can track individual Web Vitals on a per-page basis. This method allows you to correlate performance metrics with user behavior, such as bounce rates or conversion rates. For instance, a sudden spike in CLS might coincide with a layout shift caused by newly added ads or dynamic content, as explained in the Cumulative Layout Shift (CLS) Overview section.
What Tools Help You Visualize and Analyze Web Vitals Data?
Data visualization tools like Google Data Studio or third-party dashboards can transform raw metrics into actionable insights. Plotting LCP, INP, and CLS trends over weeks or months reveals seasonal patterns or the impact of code changes. For example, if LCP increases after a site update, you might trace the issue to a larger image or JavaScript file, similar to challenges discussed in the Platform-Specific Challenges and Solutions section. Setting up automated alerts is another best practice. Search Console allows you to configure email notifications when a page’s Core Web Vitals degrade below thresholds. Similarly, tools like Sentry or New Relic offer real-time monitoring for developers. One company improved its LCP from 3.2 seconds to 1.8 seconds by using automated alerts to catch a third-party script slowing down page load times.
How Can Real-World Data Drive Long-Term Optimization?
Consider a scenario where a website’s CLS score rises from 0.1 to 0.3 over three months. By reviewing historical data, you might find that a new feature-like auto-playing videos-introduced layout shifts. Fixing this could involve adding width and height attributes to media elements or deferring non-critical resources. A documented case from 2025 shows how tracking INP helped a retail site reduce input latency from 300ms to 95ms. By analyzing user interactions, the team prioritized optimizing JavaScript execution and reducing the number of event handlers. This example highlights how consistent monitoring leads to measurable improvements.
For long-term success, integrate Web Vitals into your development workflow. Conduct quarterly audits to assess the impact of new features and use A/B testing to validate optimizations. For instance, a 2024 study found that sites using performance budgets-setting hard limits for LCP, INP, and CLS-achieved a 40% lower bounce rate compared to those without. By combining real-time monitoring, historical analysis, and proactive alerts, you can maintain a site that meets both user expectations and Google’s evolving standards. Regularly revisiting your data ensures that optimizations remain relevant as technology and user behavior evolve.
Optimizing Core Web Vitals for Content Marketing
Optimizing Core Web Vitals for content marketing requires a balance between user experience and technical execution. By focusing on Largest Contentful Paint (LCP), Interaction to Next Paint (INP), and Cumulative Layout Shift (CLS), you can ensure your content loads quickly, responds smoothly, and remains visually stable. Below, we break down actionable strategies for each metric, along with best practices for content creation and publishing..
How Do You Improve LCP for Content Pages?
LCP measures the time it takes for the largest visible element (like an image or text block) to load. To reduce this metric:
- Optimize images by compressing files and using modern formats like WebP or AVIF. Tools like Squoosh can help maintain quality while reducing file size.
- Implement lazy loading for off-screen images and videos, deferring their load until the user scrolls near them.
- Preload critical resources such as fonts or key scripts. For example, adding
<link rel="preload">for essential assets ensures they load priority.
As mentioned in the Largest Contentful Paint (LCP) Overview section, prioritizing LCP helps establish a quick first impression, which is critical for user retention.
A real-world example: A news website reduced its LCP from 4.2 seconds to 1.8 seconds by replacing JPEGs with WebP and preloading its main article image..
What Strategies Reduce INP on Content Sites?
INP tracks how quickly a page responds to user interactions, like clicks or taps. To improve this:
- Minimize JavaScript execution time by splitting large scripts into smaller, asynchronous chunks. Avoid blocking render with heavy computations.
- Defer non-essential scripts such as analytics or third-party widgets until after the main content loads.
- Reserve space for ads to prevent layout shifts that delay interactivity. Use fixed dimensions for ad containers or placeholder elements.
As outlined in the Interaction to Next Paint (INP) Overview section, reducing INP ensures users perceive the site as responsive, enhancing engagement.
For instance, a blog optimized its INP by 30% by removing unused JavaScript and deferring ad scripts until after the first paint..
How Can CLS Be Eliminated in Content Publishing?
CLS measures unexpected layout shifts, which disrupt user experience. To fix this:
- Reserve space for embedded content like videos or social media widgets using
widthandheightattributes. This prevents the page from shifting when assets load. - Avoid dynamic content insertion (e.g., ads) without placeholders. Use tools like the
aspect-ratioCSS property to maintain consistent spacing. - Add
loading="lazy"to images and videos to delay off-screen element rendering.
Building on concepts from the Cumulative Layout Shift (CLS) Overview section, minimizing CLS ensures a visually stable experience, reducing user frustration.
A case study from a travel blog reduced CLS from 0.5 to 0.05 by setting fixed ad container sizes and eliminating auto-playing embedded videos without reserved space..
Best Practices for Content Creation and Publishing
- Use modern image formats like WebP or AVIF for faster load times without sacrificing quality.
- Automate asset optimization with tools like AnyPost.ai, which can generate responsive image sizes and suggest ad placement strategies.
- Use Core Web Vitals data to prioritize pages with poor performance. Google Search Console highlights specific issues, such as unoptimized images or missing placeholders.
- Test layouts before publishing using Chrome DevTools or Lighthouse to simulate real-world loading scenarios.
Building on concepts from the Measuring Core Web Vitals section, continuous monitoring and iterative testing are essential for maintaining optimal performance.
For example, a company improved its content site’s overall Core Web Vitals score by 40% after auditing and optimizing images, reserving ad space, and using WebP across all blog posts..
The Role of Automation in Optimization
Automated content generation tools like AnyPost.ai can streamline optimization by:
- Automatically compressing and formatting images to meet modern standards.
- Suggesting ad placements that minimize layout shifts while maximizing revenue.
- Generating responsive design templates that prioritize LCP and CLS from the start.
However, automation isn’t a magic fix. Teams must still review generated content for unexpected layout shifts or oversized assets that could degrade performance..
Real-World Example: A Content Site’s Optimization Journey
A mid-sized e-commerce blog faced high bounce rates due to poor LCP and CLS scores. By implementing these changes:
- Replaced all images with WebP (cut LCP by 2.5 seconds).
- Reserved ad space using fixed containers (reduced CLS from 0.4 to 0.02).
- Defer non-critical JavaScript (INP improved from 350ms to 95ms).
The result? A 50% drop in bounce rates and a 30% increase in time-on-page, directly linking performance improvements to user engagement.
By combining technical optimizations with strategic content design, marketers can ensure their pages meet Core Web Vitals benchmarks while delivering a seamless experience for readers.
Platform-Specific Challenges and Solutions
Optimizing Core Web Vitals like LCP, INP, and CLS requires platform-specific strategies due to unique constraints and tools. For example, Shopify faces challenges from app bloat and third-party scripts, while WordPress sites often struggle with heavy plugins. This section breaks down these issues and solutions, focusing on real-world fixes and tools like AnyPost.ai to streamline performance improvements.
What Are Common Platform-Specific Challenges for Core Web Vitals?
Each platform introduces unique obstacles. On Shopify, adding too many apps loads unnecessary JavaScript, delaying LCP and INP. Third-party tools like live chat widgets or analytics scripts can also cause layout shifts, hurting CLS. For WordPress, poorly coded plugins or high-resolution images without lazy loading increase load times. Custom CMS platforms might lack built-in performance tools, requiring manual optimization. The root issue is always balancing functionality with speed.
How Can Shopify Merchants Fix Core Web Vitals?
Shopify’s ecosystem offers solutions tailored to its architecture. Start by auditing installed apps-remove any that don’t drive conversions. Shopify’s Performance Report in the admin dashboard identifies slow-loading resources, while Shopify CDN caches static assets for faster delivery. For LCP, prioritize optimizing product images using Shopify’s built-in image compression tools. To fix CLS, ensure all third-party widgets (like chatbots) load asynchronously.
A real-world example: One merchant improved LCP from 4.2s to 2.5s by removing three unused apps and enabling async loading for remaining scripts. As mentioned in the Largest Contentful Paint (LCP) Overview section, optimizing LCP involves prioritizing the loading of the largest visible element. For INP, deferring non-critical JavaScript-like app embeds-until after the first paint reduced input delays by 40%. AnyPost.ai integrates smoothly into Shopify stores by generating optimized content without bloating page code, ensuring SEO and performance stay aligned.
What Solutions Work for Other Platforms Like WordPress?
On WordPress, the key is minimizing plugin overhead. Replace heavy plugins with lightweight alternatives (e.g., switch from a feature-heavy SEO tool to a minimal one). Use caching plugins like W3 Total Cache to reduce server response times and CDNs like Cloudflare to serve assets faster. For CLS, audit images and embeds-add loading="lazy" attributes and set fixed dimensions to prevent layout shifts.
Building on concepts from the Cumulative Layout Shift (CLS) Overview section, layout shifts can be mitigated by setting fixed dimensions and avoiding dynamic content loading without placeholders. A common fix for LCP involves optimizing above-the-fold content. One site reduced LCP time by 30% by compressing hero images and using WebP formats. For INP, WordPress users should defer non-essential scripts and use async/defer attributes. AnyPost.ai helps by generating clean, optimized content that avoids bloating pages with redundant text or media.
How Do Platform-Specific Tools Help?
Every platform has built-in tools. Shopify’s Theme Check identifies performance issues in theme code, while WordPress’s Health Check scans for problematic plugins. For custom CMS setups, tools like Lighthouse or PageSpeed Insights act as universal auditors.
A key best practice: Regularly audit third-party scripts. For example, Shopify’s Script Tags API lets developers load only critical scripts initially, deferring others. On WordPress, Autoptimize combines CSS and JavaScript files to reduce HTTP requests. AnyPost.ai complements these tools by ensuring content itself doesn’t introduce bloat-its streamlined workflows avoid redundant elements that hurt CLS or LCP.
What Are Universal Best Practices?
Regardless of platform, follow these rules:
- Audit third-party scripts monthly and remove unused tools.
- Lazy-load images and videos to prioritize above-the-fold content.
- Use asynchronous loading for non-critical resources.
- Compress assets using modern formats like WebP or AVIF.
As outlined in the Why Core Web Vitals Matter section, these optimizations directly impact user experience and search rankings. For example, a Shopify store improved CLS from 0.4 to 0.1 by resizing images and adding sizes and srcset attributes. A WordPress blog cut INP delays by 35% using deferred JavaScript and text compression (e.g., Brotli). AnyPost.ai’s transparent approach ensures content remains lean-its AI avoids excessive media embeddings or redundant text that could slow pages.
By combining platform-specific tools with disciplined optimization, merchants can meet Core Web Vitals thresholds without sacrificing functionality. The goal isn’t to strip away features but to ensure every element adds value-whether it’s a Shopify app, a WordPress plugin, or content generated by AnyPost.ai.
Conclusion and Next Steps
Optimizing Core Web Vitals ensures a fast, stable, and responsive user experience while boosting search engine visibility. By focusing on Largest Contentful Paint (LCP) for loading (as detailed in the Largest Contentful Paint (LCP) Overview section), Interaction to Next Paint (INP) for interactivity (building on concepts from the Interaction to Next Paint (INP) Overview section), and Cumulative Layout Shift (CLS) for visual stability (referenced in the Cumulative Layout Shift (CLS) Overview section), you align your site with Google’s 2026 standards. Let’s break down the final steps to maintain and improve these metrics.
What Are the Core Takeaways for Optimization?
Prioritize LCP under 2.5 seconds, INP under 200 milliseconds, and CLS under 0.1 to meet performance benchmarks. For LCP, optimize images, reduce server response time, and use browser caching. For INP, minimize JavaScript execution and avoid long tasks. For CLS, reserve space for dynamic content and avoid unexpected layout shifts. Tools like Google’s PageSpeed Insights and Lighthouse provide actionable diagnostics.
One company improved its LCP by 40% through lazy-loading images and preloading critical assets. Another reduced CLS by 60% by adding padding to embed containers. These examples show measurable gains in user engagement and search rankings when Core Web Vitals are prioritized.
How Can You Begin Improving Your Site?
Start by auditing your site with Google Search Console’s Core Web Vitals report to identify failing pages. Use Lighthouse for lab data and Real User Monitoring (RUM) for field data. For technical fixes:
- LCP: Compress images, defer non-critical CSS, and use a Content Delivery Network (CDN).
- INP: Break up long JavaScript tasks, adopt event handlers for interactivity, and reduce third-party script bloat.
- CLS: Add
widthandheightattributes to images, animate elements within reserved spaces, and avoid inserting new content above existing content.
Unlike generic providers, AnyPost.ai offers tailored guidance for balancing performance with content strategy, ensuring your optimizations align with user needs.
Why Is Continuous Monitoring Essential?
Core Web Vitals metrics fluctuate due to traffic spikes, new features, or third-party integrations. Set up alerts in Google Analytics 4 (GA4) or Search Console to track regressions. Re-audit after major updates using Lighthouse or web.dev’s tools. As outlined in the Monitoring and Reporting Core Web Vitals Over Time section, ongoing optimization reduces bounce rates by up to 35% and increases conversion rates by 20% over time.
For example, a retail site that implemented weekly CLS checks reduced layout shifts by 70%, improving its mobile traffic by 25%. Regular monitoring ensures your site stays competitive as user expectations and algorithmic standards evolve.
What’s Next? Take Action Now
Start with a free Core Web Vitals audit using Google’s tools, then prioritize fixes based on impact. For deeper insights, explore the Web Vitals documentation or case studies on web.dev. If you need structured support, AnyPost.ai provides actionable plans to streamline optimization without compromising content quality.
Remember: Core Web Vitals aren’t a one-time fix. By embedding performance into your development workflow, you’ll deliver a seamless experience that keeps users engaged and search engines impressed. Begin optimizing today-your site’s future depends on it.
Frequently Asked Questions
1. What are the 2026 Core Web Vitals performance benchmarks?
The 2026 benchmarks require LCP under 2.5 seconds, INP under 200 milliseconds, and CLS under 0.1. Meeting these thresholds ensures optimal user experience and search engine visibility.
2. How can I improve Largest Contentful Paint (LCP)?
Optimize LCP by lazy-loading images, preloading critical assets, and compressing images. These methods can improve loading speed by up to 40%, reducing LCP to under 2.5 seconds.
3. What tools diagnose Core Web Vitals issues?
Use Google PageSpeed Insights and Lighthouse for actionable diagnostics. Google Search Console’s Core Web Vitals report identifies failing pages, while Real User Monitoring tracks field performance.
4. How does optimizing INP enhance user experience?
Reducing INP below 200 milliseconds improves interactivity by minimizing JavaScript execution and eliminating long tasks. This ensures faster responses to user interactions, boosting engagement.
5. What causes Cumulative Layout Shift (CLS) and how to fix it?
CLS is caused by unexpected layout shifts. Fix it by reserving space for dynamic content and avoiding unstyled embeds, which can reduce instability by 60%.
6. Can Core Web Vitals optimization affect SEO?
Yes, optimizing Core Web Vitals boosts search rankings. Real-world examples show improved user engagement and measurable metric gains, directly enhancing SEO performance.
7. How do I identify pages failing Core Web Vitals?
Audit your site using Google Search Console’s Core Web Vitals report. It highlights pages failing benchmarks, enabling targeted optimizations for LCP, INP, and CLS.