
GA4, Looker Studio, and Search Ads 360 for Unified SEO Reporting

Key Takeaways
- When SEO data lives in separate tools, teams reconcile spreadsheets instead of reading performance and deciding what to do next.
- Many marketing teams report data quality issues that affect decisions, and industry costs can be significant.
- Many agencies run disconnected platforms, and manual reporting can consume a meaningful chunk of time each month.
- GA4 tracks post-click behavior, Search Console reflects Google's ranking view, and Search Ads 360 handles paid attribution - one dashboard can hold all three.
- AI content pipelines can amplify data quality problems, spreading metric conflicts across pages before anyone notices.
- Diagnose GSC-versus-GA4 conflicts first, so small discrepancies do not multiply across large-scale AI publishing.
- Real-time tracking makes every AI-generated page measurable end to end from the moment it goes live.
Why fragmented data quietly kills good SEO decisions
Split your data across three tools, and you stop analyzing performance. Keyword rankings in one place, engagement in another, paid-search attribution in a third - that's not analysis. That's reconciliation. The question my team keeps circling back to is simple: which setup actually connects analytics, attribution, and automated reporting for paid search and SEO? For us, the answer starts with real-time tracking, so every AI-generated page we publish is measurable the moment it goes live.
The cost of not unifying is real. Teams working from fragmented data make major strategic calls on flawed numbers, and budget can bleed out as a result. Agencies running disconnected platforms can burn hours a month rebuilding the same reports by hand - time that should go to optimization.
Which setup fits an AI content pipeline?
At scale, a connected reporting layer keeps automation honest. Publishing AI-created pages means pulling post-click engagement, search visibility, and paid campaign performance into one dashboard so you can watch content health as it moves.
Catch data discrepancies early, because automated pipelines can compound errors. A tracking issue at the template level does not stay small. Scale production and it gets copied across many new URLs. Fix it at the pilot stage, and your reporting stays intact as the site grows.
Why attribution earns extra scrutiny
Attribution decides how much credit your AI pages actually get. Attribution models can shift how much credit organic search receives, sometimes substantially. That's not a rounding error. That's the gap between a page reading as a winner and a page reading as a waste.
So we agree on an attribution methodology before launching AI content, not after. When AI pages sit inside multi-touch conversions alongside paid search, everyone has to measure the same reality. Skip that step, and two teams will argue about one page using two different versions of the truth.
Neither Search Console nor GA4 is "the" source of truth
People love to argue over whether Search Console or GA4 should be the primary source. They measure different stages of the journey. Search Console tracks pre-click visibility in the SERPs. GA4 tracks post-click engagement. A unified report blends them to show the full funnel instead of forcing a false choice.
One caution on measurement. A small conversion rate lift can require a large volume of sessions before it reaches statistical significance. Do not celebrate an AI page's early numbers on thin traffic. Real-time tracking helps here, giving you a live view of traffic accumulation so you know when a page has enough data to trust. As one reporting guide puts it:
"Automated reports allow teams to focus on strategy and optimization rather than data collection."
Setting up GA4 so it feeds clean data, not chaos
GA4 anchors unified reporting because its event model ties every organic session to real behavior and conversions. Set it up right and you get one measurement layer feeding your dashboards. Set it up wrong and your week disappears into reconciling numbers instead of acting on them.
Post-click behavior is where content quality shows up. Search visibility tells you a page ranks. GA4 tells you whether visitors actually engage or bounce on arrival. For automated pipelines, those engagement signals help you spot which templates drive real business value and which just fill space.
How do you set up a GA4 property for SEO tracking?
Create a new GA4 property, then configure a web data stream for your domain. That single stream captures pageviews, scrolls, and outbound clicks automatically through enhanced measurement.
Link Search Console to the property next. This pulls query and landing-page data into GA4, so search visibility and on-site behavior sit side by side. For any AI-published page, tag it with consistent UTMs at launch so organic and paid traffic stay cleanly separated downstream. Pick clear tagging conventions that distinguish content sources and campaigns, and stick to them.
Which events and conversions should you track?
Track engaged sessions and organic conversions as your core SEO signals. By default, an engaged session fires when a user spends at least 10 seconds on the page or views more than one page. That threshold is your first real quality filter for AI content.
Mark the actions that matter to the business as conversions: form fills, demo requests, sign-ups. Organic conversions tell you whether SEO drives outcomes, not just traffic. Lock in your baseline early. For example, if existing organic traffic converts at 3.5%, record that number before launching AI content, so you can measure actual lift against a known start.
Why GA4 on its own falls short
GA4's native reporting is thin, and its data is scattered across menus. For real dashboards, you export to Looker Studio. GA4 collects well but presents poorly, and both problems point the same direction.
There's a scaling wrinkle too. GA4's reporting API runs on daily token quotas, and every dashboard component counts as a request. Publish many AI pages and page-level tracking can chew through quota fast. Build quota-aware dashboards that prioritize high-value page segments over exhaustive per-URL tracking. Reports stay fast, data stays honest.
One more thing to settle before launch. GA4's default session timeout is 30 minutes. For long-form AI content or comparison guides where people read for a while, that timeout can split a single visit into multiple sessions and inflate your engagement metrics. Adjust it to match how users actually read, or accept that session counts will run higher than reality.
Bringing it together in Looker Studio
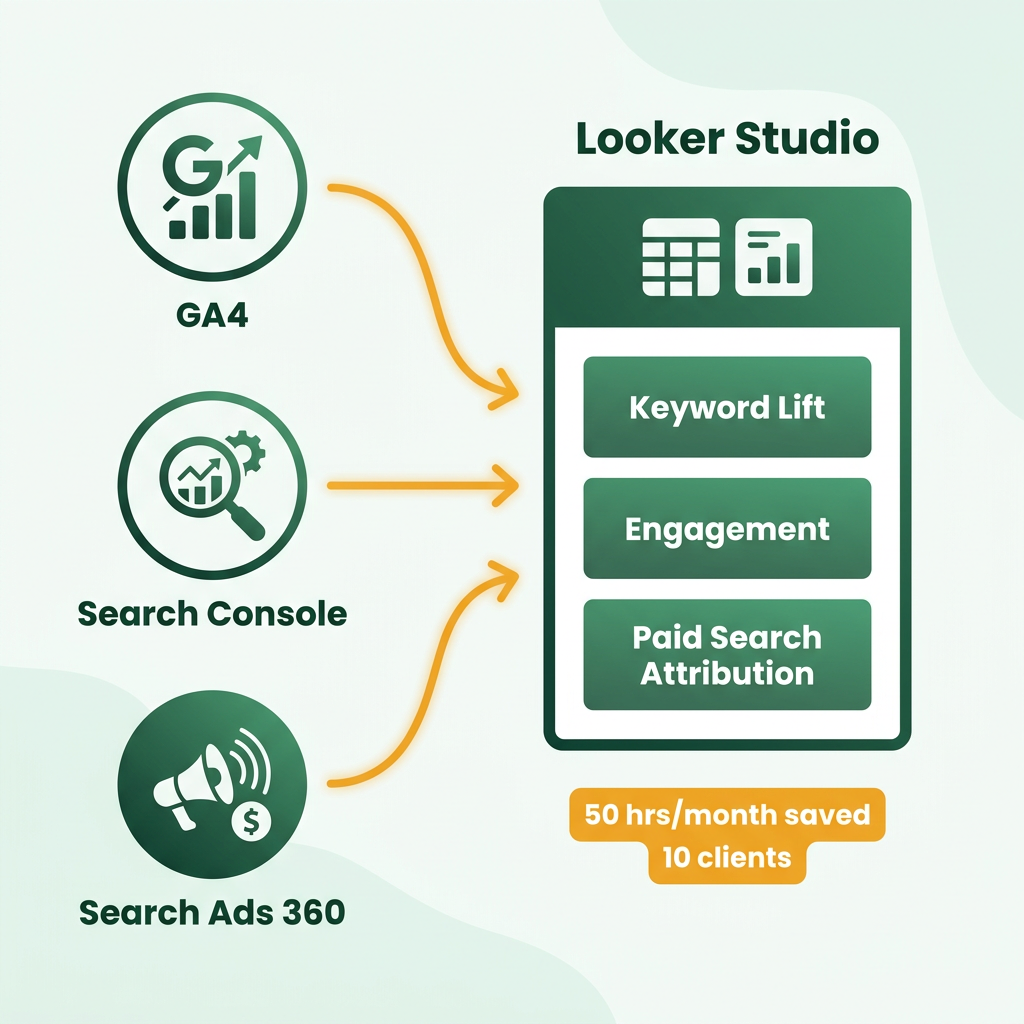
Looker Studio is where GA4, Search Console, and Search Ads 360 stop being three separate tabs and start being one picture. For an AI content pipeline, that matters. Publishing pages at volume, we need keyword lift, engagement, and paid-search attribution side by side, not hand-stitched every Monday.
A centralized visualization layer connects straight to Google's data sources. No manual exports, no spreadsheet compilation, more time for the analysis that actually moves things.
How do you connect GA4 and Search Ads 360?
Start a new Looker Studio report and add data sources one at a time. GA4 and Search Console use native connectors, so those link in minutes. Search Ads 360 is the odd one out. Its Looker block pulls data through the BigQuery Transfer Service, so you route SA360 into BigQuery first, then connect Looker to that dataset.
The payoff is a single view across engines. The SA360 overview surfaces campaigns wherever they run, while the campaign and keyword dashboards track profitability over time. That's how we tie paid-search spend back to the same AI pages we're ranking organically.
To manage API limits on large datasets, use Looker Studio's extract data connector or schedule regular refreshes. That keeps the dashboard from hitting the live GA4 API on every page load, so reports stay functional even when you're tracking high volumes.
Which metrics belong on the dashboard?
Lead with outcomes, not vanity counts. The metrics that earn a slot are organic sessions, engaged sessions, conversions, and revenue, plus Search Console clicks and CTR for the visibility layer. Together they let you read the whole journey, from search result to final action.
When you blend these sources, keep their metrics separate rather than mashing them into one hybrid field. Blend by landing page or date, so you can compare search visibility trends against on-site conversion rates without distorting the underlying data.
Design for the next action, not the data dump
A good dashboard answers a question in seconds. The strongest templates I've seen surface the key insight quickly and cut wasted ad spend by flagging underperforming campaigns fast. As one dashboard specialist put it:
"Dashboards should not just show numbers; they should guide you to your next action."
Keep the layout tight. Use consistent filters across every widget, a restrained color scheme, and scheduled delivery so the report lands in stakeholder inboxes on its own. Decision-makers see the trend without ever opening the platform.
Joining organic and paid at the page level
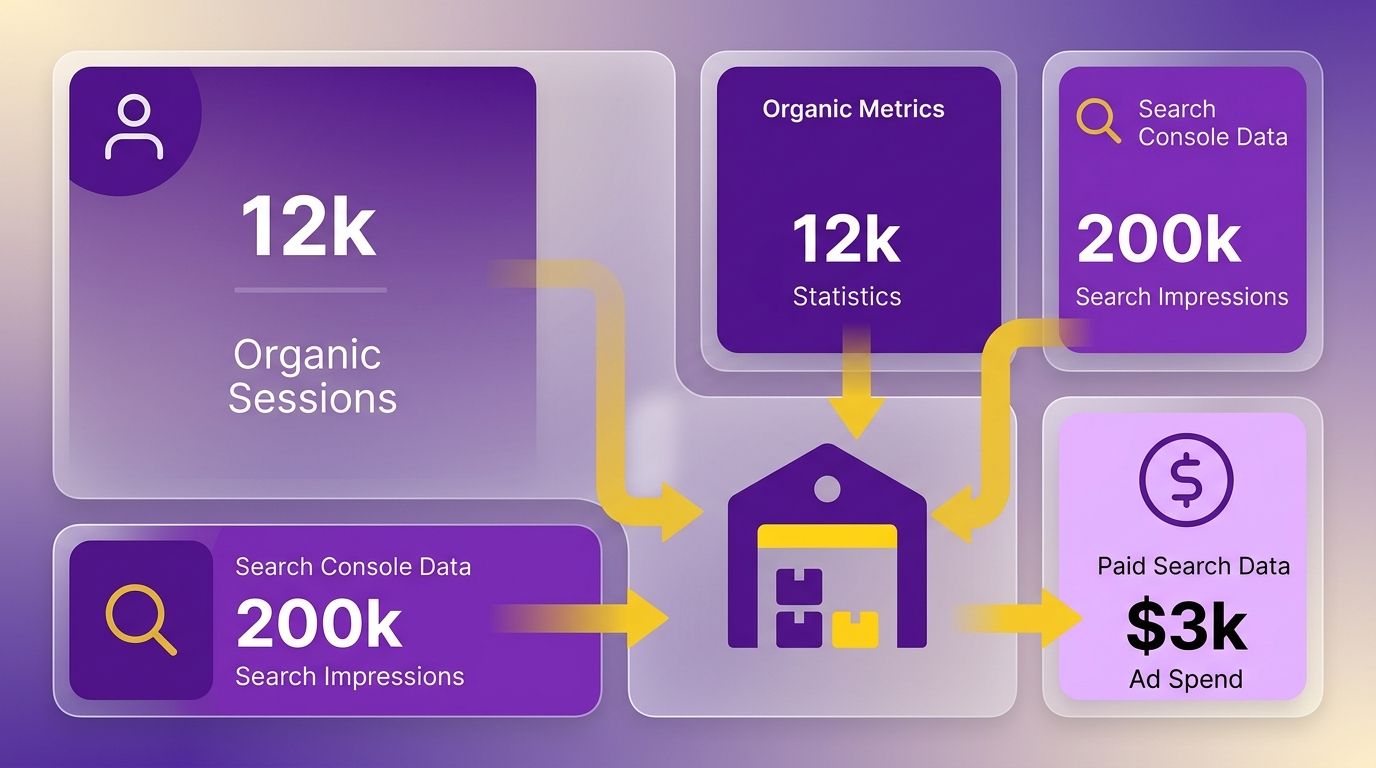
Merging Search Console and Search Ads 360 comes down to a shared warehouse. Once both land in one place, you can join organic and paid-search performance against the same set of AI-generated pages instead of hopping between tabs.
A warehouse-first setup joins disparate datasets on common keys like URL or date. Consolidate the data and you can see how organic rankings and paid campaigns interact page by page, which gives you the full search footprint in one view.
How do you connect the three sources?
Start with the connector layer, then move to the warehouse. Search Ads 360 needs the SA360 Looker block, which ships pre-built views: the Overview, Campaign Performance, and Keyword Performance dashboards.
That block is a community-supported template, so validate its outputs against the raw BigQuery tables. Confirm the SQL in the block matches your schema before you trust it, or reporting errors will slip through to the final dashboards.
The keyword-level view is where paid and organic finally talk to each other. When an AI page ranks organically for a term you also bid on, the merged data shows whether paid clicks cannibalize the organic ones or expand your total coverage.
Keeping attribution honest at scale
Merged data is exactly where attribution gets dangerous. When AI pages feed multi-touch conversions alongside paid search tracked in SA360, an unagreed model quietly rewrites which channel gets the win. Lock the model first, document it, then let automation run.
That also means respecting the limits of each platform. Do not force different tools to match. Use each one to measure its own slice of the funnel - Search Console for organic visibility, ad platform data for paid conversion paths.
Troubleshoot metric conflicts before you scale
Fix conflicts before adding pages, not after. GSC clicks and GA4 sessions rarely match, because GA4 needs JavaScript execution and cookie acceptance while Search Console counts raw search clicks. That gap is normal. A widening gap is a signal.
Validation rule: reconcile search clicks against organic sessions per landing page before expanding your content footprint. As long as they stay within a normal tolerance, tracking errors are not skewing your data. Then compare paid click counts against referring traffic in your analytics platform. If paid clicks noticeably exceed tagged traffic, check tag firing order or JavaScript blockers and resolve it before running the pipeline.
Building a reporting stack that survives GA4's changes
Future-proofing GA4 means treating your reporting stack as something that shifts, not something you build once and forget. Google ships schema changes, new metrics, and connector updates on a steady cadence, and each one can quietly break a dashboard feeding your AI pages. Build for change from the start.
Plan for updates instead of reacting to them. When a GA4 metric gets renamed or a field moves, a warehouse-first setup with clear field mapping absorbs the change in one place rather than across a dozen brittle reports.
How do you track and adopt GA4 changes?
Watch Google's official release notes and your property-level change history, then test updates in a staging property before they touch production dashboards. A duplicate test property lets you validate new metric definitions before they hit live reports. If engagement or conversion numbers drift after an update, you catch it in staging, not in a Monday client report. Google's analytics webinars explain the "why" behind schema shifts, which helps you decide what to adopt and what to skip.
Preparing for schema changes and new metrics
Schema changes are a major risk to automated reporting, so isolate raw data from your presentation layer. Store GA4 exports in a warehouse, then build dashboards on stable views instead of live fields.
Schema abstraction means a warehouse view that renames and reshapes GA4 fields, so a Google-side change updates one query rather than every report. When a new metric or threshold lands, fold it into that central view and every downstream dashboard inherits the update automatically. Reporting stays consistent across all your URLs.
That abstraction protects your feedback loop too, letting you read engagement and conversion lift straight from the dashboard and refine content quickly. Teams running large volumes of AI-generated pages often find iteration cycles get faster when schema changes get absorbed at the warehouse layer instead of pushed to individual reports. One update propagates everywhere, and your analytics hold steady as you scale.
Troubleshooting common GA4 update issues
Most post-update problems trace back to three causes: broken connectors, changed field names, or conversion events that stopped counting. Check them in that order.
When a dashboard goes blank, reauthorize the GA4 connector first. When numbers look wrong, compare the field name against the latest schema. When conversions flatline, confirm your key events still fire after the update. Log every fix in one place so recurring issues turn into patterns you can automate around. Skip the heavy schema abstraction if you run a handful of pages and one dashboard - the overhead only pays off once you're tracking AI content at scale.
Frequently Asked Questions
1. Why do GA4 sessions and Search Console clicks never match exactly, and when should I worry?
A baseline discrepancy is expected due to differences in how each platform records user interactions. You should investigate when this variance deviates significantly from your historical baseline. A sudden shift often points to tag implementation errors, slow page load times preventing tracking scripts from firing, or consent banner misconfigurations.
2. How do I prevent AI-generated pages from burning through GA4's daily API quota?
To avoid API limits, route your GA4 data into BigQuery and connect Looker Studio to the warehouse tables instead of querying the GA4 API directly. Alternatively, use Looker Studio's extract data connector to schedule regular refreshes, which limits the number of active requests generated by your dashboard components.
3. Should I adjust GA4's 30-minute session timeout for long-form content?
You can modify this setting in the GA4 Admin panel under Data Streams > Configure Tag Settings > Adjust Session Timeout. Before changing the default, review your average engagement time and scroll depth to determine if your readers regularly exceed the half-hour mark on long-form resources.
4. What happens when paid and organic search compete for the same keyword after merging SA360 and Search Console data?
Merged data reveals whether paid clicks cannibalize organic rankings or expand total coverage. When an AI page ranks organically for a term you also bid on, compare click volumes and conversion rates across both channels. If paid spend increases while total clicks stay flat, cannibalization is likely costing you money.
5. How do I validate that Search Ads 360 Looker block data matches reality before trusting it?
Run parallel queries in your data warehouse to verify that the metrics pulled by the Looker block align with your raw tables. Audit campaign-level spend and conversion totals over a recent window. If you detect meaningful discrepancies, check for timezone mismatches or differences in data refresh intervals between the systems.
6. What statistical threshold proves an AI page actually improved conversion rates?
To confirm a true performance improvement, use a statistical significance calculator to evaluate your conversion data based on sample size and baseline conversion rates. Avoid making permanent template changes based on early, low-traffic trends, as small sample sizes are highly susceptible to random variance.