
Search Engine Land’s 2027 SEO Reporting Model, Applied: Automated Reports That Connect Rankings, AI Visibility, and Revenue

Why the 2027 SEO Reporting Model Matters
Most teams underestimate the reporting side, not content creation. A report built for ten blue links hides what leadership asks for. You present better rankings and traffic, then someone asks about revenue and silence follows. The 2027 model ties rankings, AI visibility, and revenue into one view instead of three separate tabs.
Automated SEO reporting grows important as AI answers appear. Search behavior may shift to AI‑generated results and zero‑click experiences. Rankings can stay steady while clicks erode. A rank‑only report may show green and miss this shift.
Why Does Rank‑Only Reporting Create a Blind Spot?
Rank‑only reporting fails because it measures a surface users increasingly skip. AI Overviews and generative answers absorb attention that organic listings once captured. A ranking that once drove predictable clicks may now be worth less.
Generative answers can satisfy a query without creating a session, undercounting impact. They also build brand influence through citations that never generate traffic. Traffic and revenue may move opposite when strategy shifts to high‑intent buyers. Metrics can break before strategy does. A traffic‑only report would flag this as a loss.
What Does Automated SEO Reporting Actually Pull Together?
Automated SEO reporting can unite five metric groups: rankings, AI visibility, traffic, leads, and revenue. AI visibility includes presence in generative answers, citations, and local packs, not just classic results. The goal is to show whether search work produces pipeline, not just impressions.
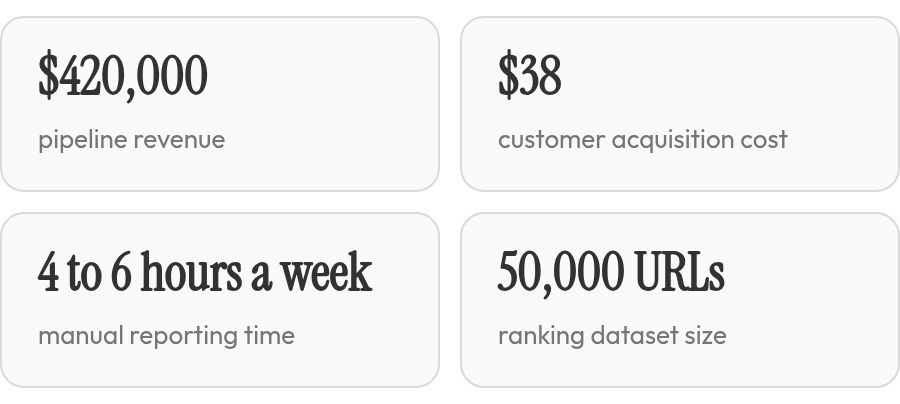
Automation saves time, but scale varies by team. Manual reporting can consume several hours per week for in‑house SEO leads and often costs agencies more in labor than tools, depending on accounts and depth. The bottleneck is often analyst time reconciling data, not the software.
New surfaces such as ChatGPT, Gemini, AI Overviews, and local packs enter the reporting mix. Automation does not always shrink total reporting time; it enables coverage of otherwise dark ground. We build this feedback loop at AnyPost.ai so insights flow into content that targets data gaps. For mechanics, see our guide to automated SEO client reports.
When Is This Model Overkill?
Skip the full five‑group model if you run a single landing page with no content program. Revenue attribution and AI visibility add setup effort that won’t pay off when there’s nothing to optimize. For teams with real content and leads, rank‑only reporting is often the expensive option, hiding cost in guesswork.
What This Model Actually Does
The 2027 SEO reporting model shifts focus from “what ranked?” to “what influenced revenue?” The effective version does not treat rankings, AI exposure, traffic, lead quality, and closed business as separate stories. It joins them early so a team can see which queries need more content, which pages lose visibility in answer engines, and which organic touches appear in pipeline.
Clean reporting depends on aligned date ranges, consistent landing‑page identifiers, and CRM data that joins to search activity. A dashboard should separate diagnostic from executive metrics. AI visibility tracking belongs because a brand can influence a buyer in a generated answer without a click. Revenue attribution belongs because traffic alone can make a wrong strategy look right.
Worked Example: Before and After (Hypothetical)
Before the model, a B2B team sees a cluster improve from page two to top‑five rankings, with a slight lift in organic sessions. AI citation presence is not tracked, so leadership cannot separate visibility gains from traffic change. After applying the model, the team tracks citation presence across a query set and sees it move from absent to frequent. Pipeline attributed to the cluster becomes visible once assisted touches are credited. The team shifts content from general posts to briefs aimed at queries with weak citation presence. Rankings, AI visibility, traffic, pipeline, and content output now form a single decision loop.
Data Foundations: Pulling Rankings, AI Visibility, and Revenue Signals
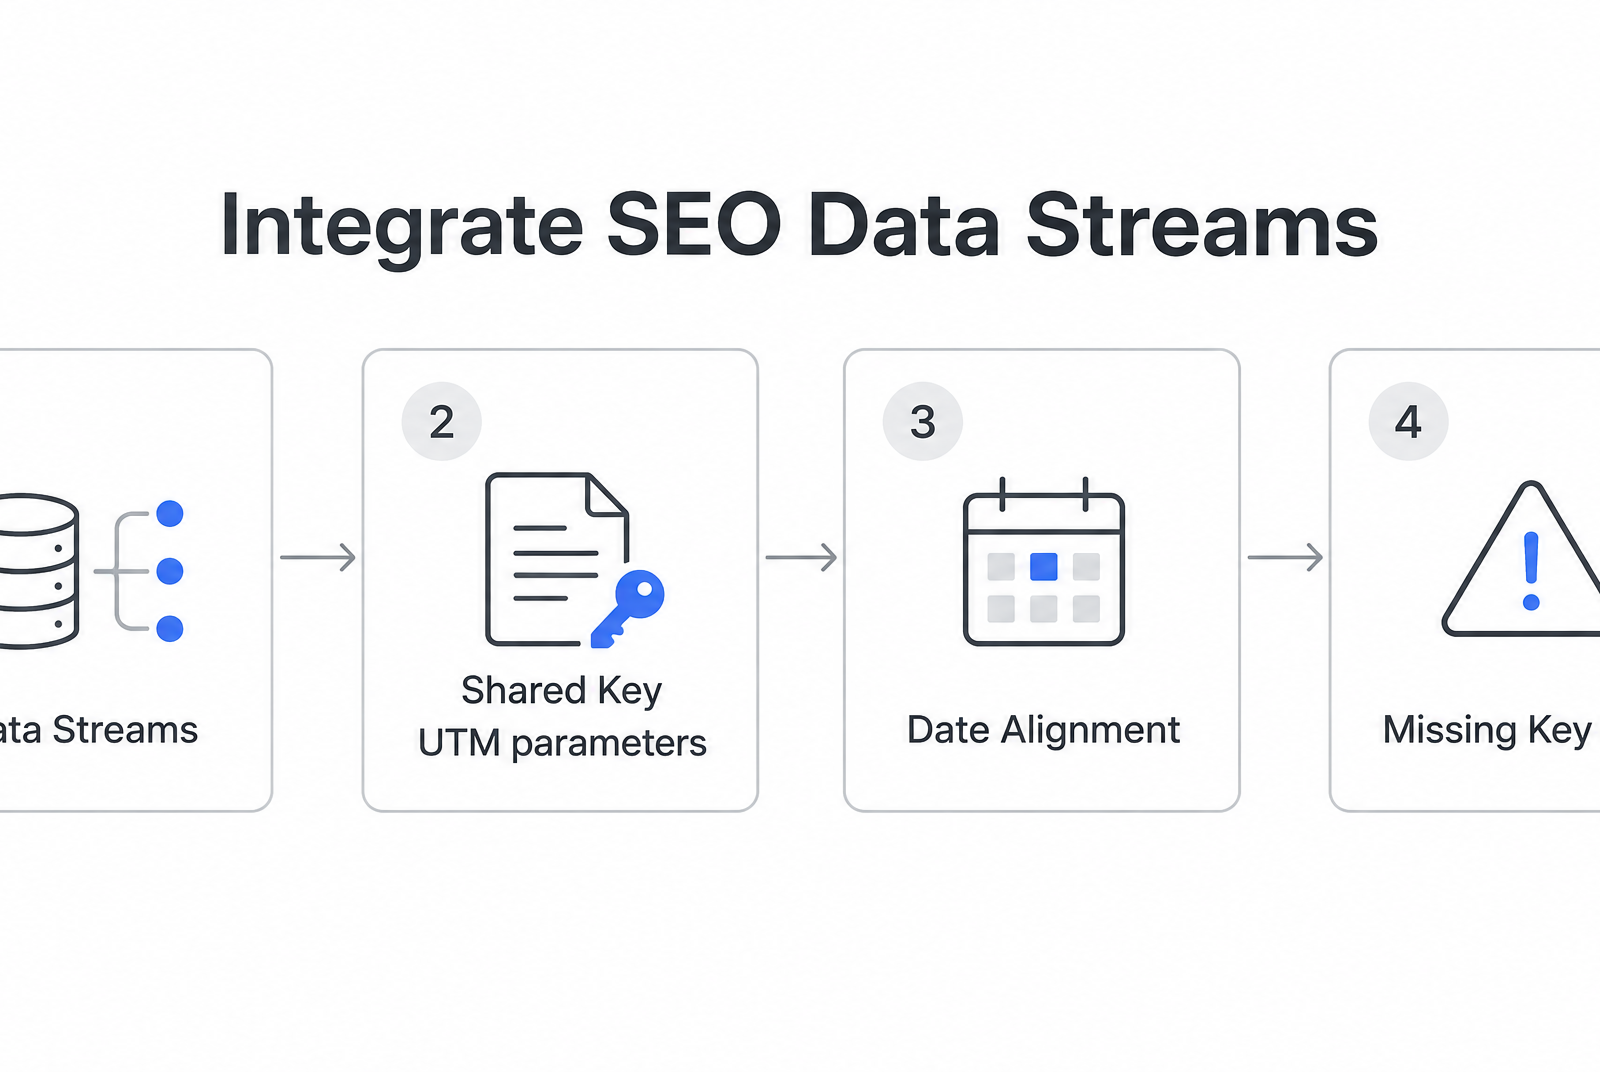
Three data streams feed this model, and they do not naturally speak to each other. Rankings live in one Google product. Behavior and conversions live in another. Revenue sits in your CRM, formatted differently. Automated SEO reporting fails when these streams cannot join on a shared key.
Before building a dashboard, identify where each signal lives and which identifier stitches them together. Get the plumbing right and automated reporting becomes a feed into larger content aligned to revenue‑moving queries. Get it wrong and you waste afternoons reconciling spreadsheets.
Rankings And Impressions Live In Two Separate Google Products
Search Console is the ranking source of truth. It reports impressions, clicks, average position, and indexation status at page and query level. This granularity lets you tie a keyword to a URL.
GA4 picks up where Search Console stops. It tracks post‑click activity: organic traffic, landing pages, engagement, and conversions. If a page ranks well but no one converts, GA4 shows whether they bounced or stalled before the key action.
Authenticate both APIs with a service account, then pull the same date range. Date‑range misalignment is a quiet killer. Search Console data can lag GA4, so a naive join may double‑count or drop rows. Most setups wire these two together via connector tools or custom scripts that normalize date windows before joining.
AI Visibility Is The Pillar That Barely Existed Two Years Ago
Some platforms now expose AI‑related reporting fields; check Search Console help and your analytics configuration for availability. Some setups separate traffic from generative sources, while others rely on third‑party SERP trackers to fill the AI Overviews gap.
AI search can influence more decisions than session data shows. A brand can appear in an AI answer, shape a buying decision, and send almost no trackable session. Your schema needs a visibility column that is not a session count, because value can appear before any click.
Revenue Needs One Join Key, And UTMs Are It
Rankings and clicks mean little to a CFO; pipeline matters. Pull organic‑sourced and organic‑assisted pipeline from your CRM, including order ID, transaction value, and assisted‑conversion flags. The difference between “we improved average position four spots” and “organic search delivered measurable pipeline at a defined CAC” is a nod versus a budget renewal.
The join runs on UTM parameters or GA4 custom dimensions carrying the landing‑page path. Keep the schema minimal: a keyword row, a page row, an AI‑visibility flag, and a revenue row sharing the UTM key. Treat missing revenue as zero, not blank, so math stays honest when a session never converts.
Building the Automated Data Pipeline
Most teams assume pulling data is the hard part of a pipeline. In practice, keeping data alive after launch is harder. A connector that ran flawlessly in week one may go dark in week six when a platform renames a field, and nobody notices until a client review.
Before scheduling a job, decide where joined data lives. A centralized warehouse (BigQuery or Snowflake) can store rankings, AI visibility signals, and revenue side by side on a shared key. This decision turns automated SEO reporting from three disconnected exports into a feed your content engine can query.
The Load Step Is Where Automation Quietly Breaks
Most pipelines load every row on each run, even when only a few records changed overnight. This works until the ranking dataset grows large enough that full refreshes compete with transformation jobs for warehouse slots.
Incremental loading solves this. Extract only records modified since the last successful run, then upsert on a composite key. This adds little logic but can cut runtime meaningfully once the dataset matures.
The load step can land clean, query‑ready tables so an insight layer reads them without reshaping. Don't load everything just because you can. More metrics often bury the signal. Filter when turning data into a recommendation, not by adding columns to the warehouse.
Schedule for the Decision, Not the Refresh
Near‑real‑time sounds appealing until you realize most SEO decisions don't move hourly. Rankings and AI visibility often refresh daily, revenue follows the CRM cadence, and intraday polling is reserved for genuine alerts.
Over‑refreshing creates problems. A single number pulled this morning tells little without a monthly comparison. The schedule should serve the stakeholder’s question, not the API’s frequency. Partition warehouse tables by date so historical comparisons run quickly instead of scanning the full dataset each time.
Build It to Survive the Next API Change
A lightweight orchestration tool earns its keep here. It retries failed pulls, logs broken sources, and stops a silent partial load from poisoning your revenue join. Without it, an upstream schema change shows green in the dashboard while underlying data is quietly wrong.
Two habits make the difference. Version your transformations so you can see exactly what the pipeline did last quarter versus now. Wrap each extract in error handling that alerts you, not the client, when a field disappears.
Get this right and the payoff compounds. The same warehouse that answers “what moved revenue” can also feed a query‑level gap log: which queries lost citation presence, which pages decayed, and which clusters should enter the next content cycle. That makes reporting insight operational instead of archival.
Connecting the Dots: Attribution Models that Link Rankings to Revenue
The jump from a clean data pipeline to an actual revenue number is where most SEO reports stall. Rankings, AI visibility, and CRM dollars sit in the same warehouse, joined on a shared key. Now you must decide which keyword gets credit for which sale. That decision is the whole game, and it’s the stage automated SEO reporting often skips.
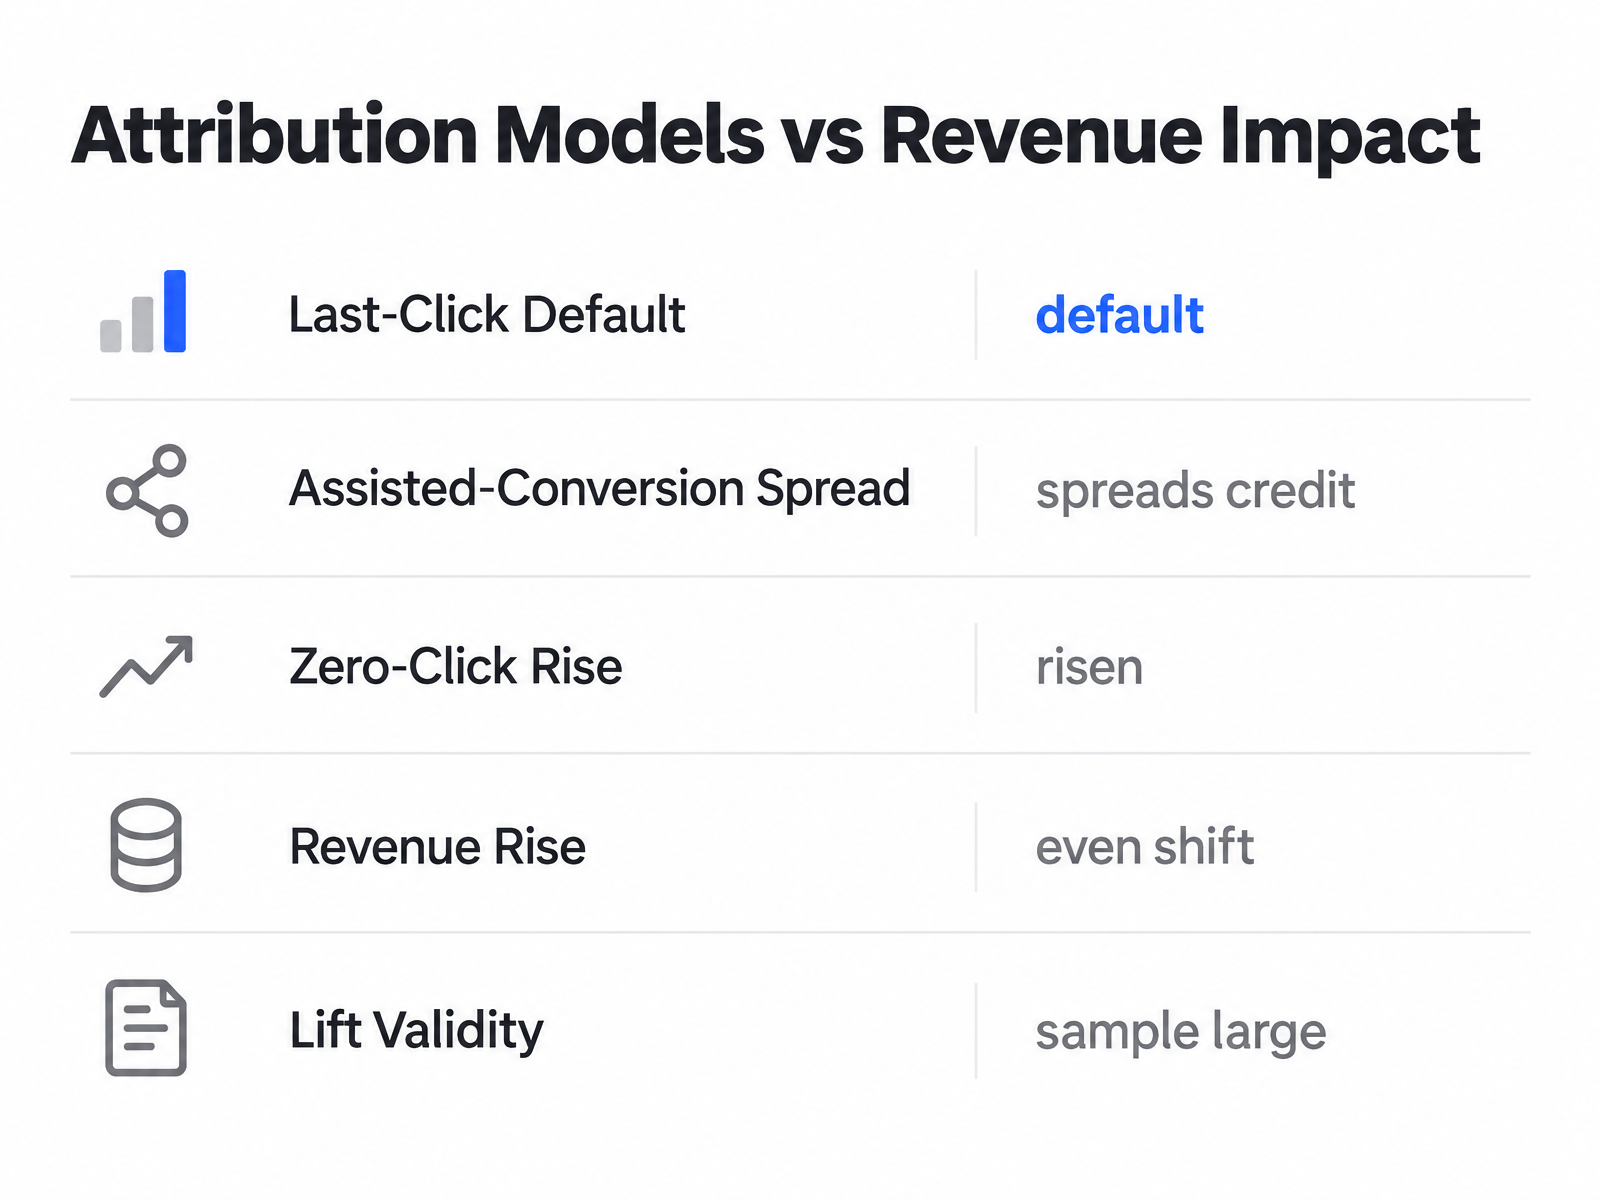
Last‑click attribution is the default because it’s easy. When a deal closes, you credit the final touch, the last page the buyer landed on. In our experience this model punishes top‑of‑funnel content that does the real convincing. A buyer reads a comparison guide in week one, returns via branded search in week six, and last‑click gives the guide no credit.
What Does Multi‑Touch Attribution Actually Change?
Assisted‑conversion models spread credit across every organic touch in the journey. A ranking lift on an informational query that opened the relationship counts. So does an AI‑visibility spike that placed you in an AI Overview the buyer never clicked but remembered.
Zero‑click searches have become more common as AI Overviews appear more frequently in search results. Rank‑only reporting can miss this shift. Visibility still lands; the session just never happens.
How Do You Calculate Incremental Revenue Per Keyword?
Take a keyword cluster, pull its ranking position and impression trend, then join closed‑won revenue from contacts who touched those pages.
Baseline: Record revenue attributed to the cluster over a stable period before any ranking change.
Lift window: After a position gain, measure revenue from the same cluster, weighting assisted touches rather than only the last one.
Incremental delta: Subtract baseline from lift. That gap, not raw traffic, is the number your CFO wants.
Traffic volume alone doesn't tell the full story. When ranking improvements target high‑purchase‑intent keywords and stronger product pages, revenue can rise even as session counts shift. Attribution prevents this from looking like a contradiction.
When Should You Trust the Number?
Not every ranking wiggle deserves a revenue story. Small clusters with a handful of conversions produce noise, not signal. We treat a lift as real only when the sample is large enough that the delta wouldn't vanish on a reslice, and when the trend holds across multiple reporting periods.
Flat or falling traffic paired with rising revenue can indicate sharper targeting rather than a problem. That frame moves rooms: not “average position improved four spots,” but a pipeline figure tied to acquisition cost. The last mile turns winning query clusters into a short backlog for the next content cycle, prioritized by revenue movement and citation gaps.
Measuring AI Visibility: Tracking Answers, Citations, and SERP Features
The measurement problem nobody budgeted for is that classic proof points may no longer capture the full influence of search. Clicks and sessions still matter, but generated answer panels can make a brand visible before a user reaches a website. Traditional dashboards were never designed to account for that influence.
Automated SEO reporting now must measure exposure inside results that may not produce an immediate visit. If your dashboard treats sessions as the only proof of visibility, it will miss the upper layer of influence that AI answers create.
Presence, Position, And Pull Are Three Different Numbers
AI visibility is not a single metric. It splits into three, and conflating them leads to errors.
Presence is binary: does your brand appear in the AI answer or citation panel? Position is where you sit among the sources the AI pulled from. Pull is the click‑through you still capture despite the answer sitting above you.
A rank tracker built for ten blue links can miss all three. Some modern tools can detect AI‑SERP features across traditional search, local pack, AI answers, AI citations, and video search in one framework. This matters because humans cannot manually compile citation presence across ChatGPT, Gemini, and AI Overviews at scale.
Brand Mentions Beat Clicks As Your AI KPI
In AI answers, a mention without a click still carries value. Being cited as a source matters for brand authority, even when the user never clicks through.
Therefore the KPI next to traditional rankings should be citation share, not click volume. Track how often you appear as a source across target queries, then watch branded search volume and impressions as a proxy for answer influence.
This measurement shift can reveal results that look broken on paper. Traffic may flatten or dip while lead quality and revenue climb, because lower‑intent browsers vanish into zero‑click answers while buyers keep arriving.
Check AI Visibility Daily, Not In Real Time
Real‑time AI visibility monitoring sounds appealing. Skip it. AI answer panels shift query by query, and chasing minute‑level changes burns effort on noise. A daily pull captures real movement without false alarms.
The payoff is operational: once you track which queries lose citations, you can build a weekly gap list mapping each missing or weak citation to a target page to update or create. For the pipeline, see our guide to automated SEO client reports. Reporting becomes an input to the next content decision rather than a monthly summary.
Automated Reporting Dashboard & Stakeholder Templates
A dashboard isn’t finished when it looks good. It’s finished when three different people open it and each sees the number they need. That stage many teams skip, and it determines whether automated SEO reporting earns its keep or becomes an unused tab.
Make this design choice early: the live dashboard should include a query‑level exception table for content production. Each row should show the query, target page, rank change, citation‑presence change, and a recommended action. This turns the dashboard from a rear‑view mirror into a work queue.
What Should Each Stakeholder Actually See?
One dashboard, three audiences. The mistake is showing everyone the same screen.
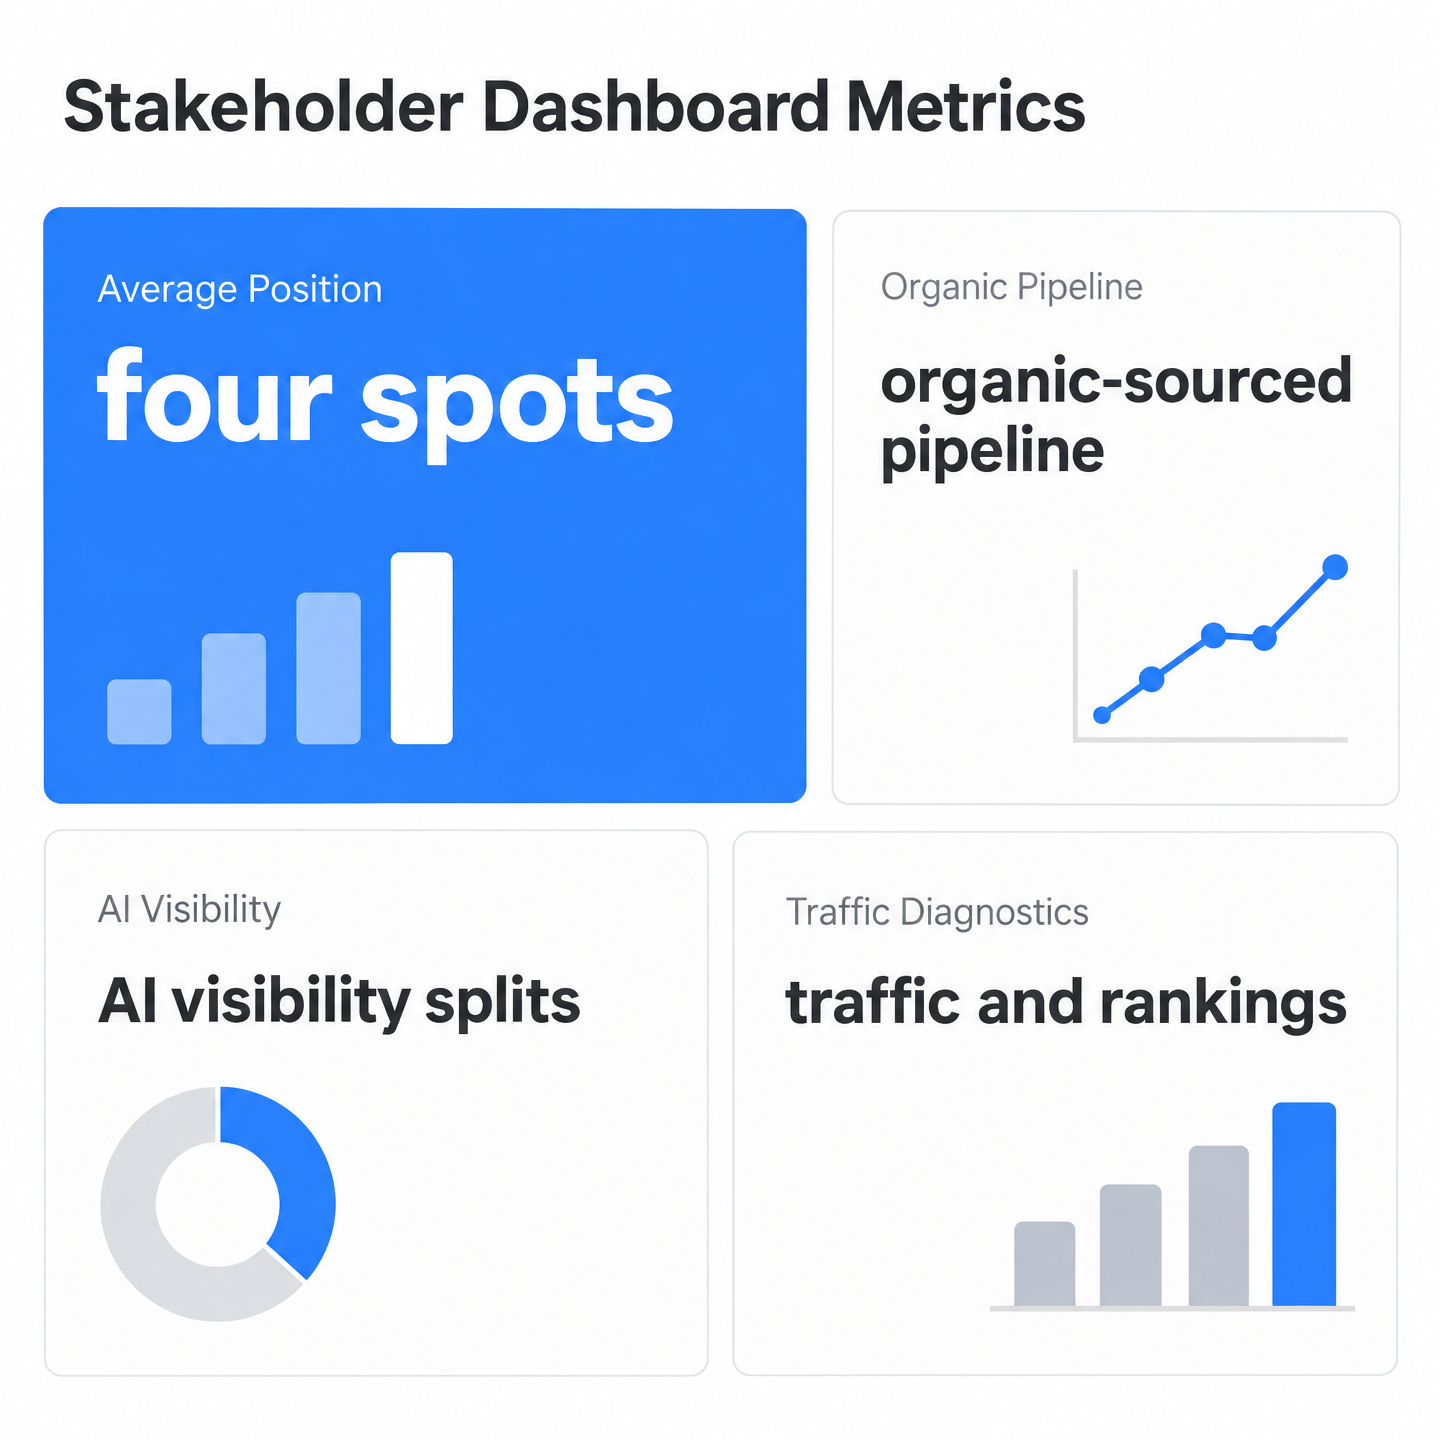
Your SEO manager needs the granular layer: ranking trend lines, impression shifts, and AI visibility splits by query. These signals tell them which pages are decaying before a monthly comparison confirms it.
Finance and executives need something else. When you tell a CFO you improved average position by four spots, they hear noise. The executive view should lead with organic‑sourced pipeline, organic CAC versus paid CAC, and a simple ROI line. A revenue waterfall works well, showing how rankings and AI citations roll up into closed deals.
One school still treats organic traffic, keyword rankings, conversion rate, and engagement as the core four. Another argues those are obsolete once AI Overviews absorb clicks. Our view: the split is about audience, not right or wrong. Internal teams keep traffic and rankings for diagnostics. The C‑suite view drops them for pipeline and CAC.
How Often Should the Dashboard Refresh?
Cadence depends on how fast the account moves; mismatching it wastes everyone's attention.
Monthly reports fit most retainers. Weekly suits fast‑moving projects where rankings swing often. A live dashboard serves clients who want to check between calls without emailing you. Real‑time analytics tracking can surface anomalies as they happen, while scheduled comprehensive reports provide context stakeholders need to act.
Resist cramming every metric in. A screen that shows everything hides the one thing that matters.
Where Does Automated Narrative Come In?
Numbers alone still leave stakeholders guessing. The valuable layer is a sentence that explains why a metric moved and what to do.
AI‑generated summaries can help here. Instead of “traffic down 12%,” the narrative may read “three pages lost rankings after competing content expanded, and here’s the fix.” The explanation should end with an owner and next action; otherwise it is just commentary. Automated content generation can turn those insights into briefs or drafts, but only after a human decides which gap is worth addressing.
Best Practices, Common Pitfalls, and Future‑Proofing
The habits that keep a pipeline accurate are boring, and that’s why teams skip them. Nobody schedules a reminder to rotate an API key. Then a token expires mid‑month, a connector goes dark, and revenue numbers in the next review are quietly wrong.
Treat maintenance as part of the build, not an afterthought. A pipeline survives reality because someone versions the schema, sets token refreshes on a fixed cadence, and runs a weekly data‑quality audit that flags when a stream stops updating. These habits catch silent failures before a client does.
What Breaks First In A Reporting Pipeline?
Schema drift is the usual culprit. A platform renames a field, your join key stops matching, and rows that used to reconcile now fall on the floor. Version your schema so the pipeline can warn you instead of guessing.
API keys are the second. Build a rotation window into your maintenance schedule so a refresh never collides with a reporting deadline. Treat the audit as a smoke test: does every stream show fresh data today, and do row counts look sane against last week?
The expensive mistakes are in the data itself. Mixing organic and paid traffic into one bucket inflates SEO numbers and credits the wrong channel. The fix is a clean filter at the warehouse layer, documented so the next person doesn’t undo it.
Which Pitfalls Quietly Corrupt The Numbers?
Watch for AI‑feature decay. An AI Overview can cite your page one month and drop it the next, so a June snapshot looks nothing like August. If your dashboard only shows the latest state, you’ll miss the erosion entirely.
Treat answer‑engine exposure as an early signal rather than a traffic forecast. It tells you where the brand is included, excluded, or displaced before patterns appear in downstream metrics.
That’s the trap of chasing raw traffic. High organic traffic with weak conversions usually means you rank for queries that don’t match intent, not that SEO works. More indexed pages won’t help; low‑value pages waste crawl budget and dilute important signals.
How Do You Future‑Proof The Setup?
Modularize. When search platforms ship new AI‑related features, teams with a plug‑in pipeline can add the source quickly. Teams with hardcoded connectors rebuild from scratch.
Build the pipeline so each new SERP feature slots in as its own module, and ensure the output includes a ranked gap list for content decisions. That loop, covered in more depth in SEO client reports, keeps the system useful as search shifts.

FAQ
What happens when rankings stay flat but traffic drops anyway?
Treat it as a visibility‑distribution problem, not automatically as an SEO loss. The report should separate classic organic performance from answer‑engine exposure so you can see whether demand moved into surfaces that rarely send visits.
How much time does manual reporting actually consume before automation?
Enough that the hidden cost is usually not the reporting tool itself. The real drain is analyst time spent exporting, cleaning, reconciling, and explaining data from systems not designed to align.
When should a business skip the full five‑group reporting model?
Use a lighter setup when there is no meaningful content engine, CRM attribution, or optimization backlog. If the business cannot act on AI visibility or revenue insights, the extra instrumentation becomes decoration.
Why does date‑range misalignment between tools break reports?
Because two platforms can describe the same period differently depending on freshness, processing delay, and attribution timing. Before joining datasets, the pipeline needs a single reporting window and a clear rule for when data is considered complete.
How do you calculate incremental revenue for a specific keyword cluster?
Compare a stable pre‑change period against a post‑change window for the same cluster, then credit all meaningful organic touches in the buyer journey. The useful answer is the change in attributable business, not just visit movement.
What makes AI visibility different from traditional ranking metrics?
Traditional rankings measure where a URL appears in classic results. AI visibility asks whether the brand or page appears inside generated answers and is cited as a source, influencing buyers before a conventional click.
Should executives see the same dashboard as the SEO manager?
No. Operators need diagnostic detail to fix pages and prioritize content. Executives need a business view that makes budget, efficiency, and pipeline impact obvious without interpreting search mechanics.
Why does rising revenue sometimes pair with falling traffic?
Because not all organic visits have equal value. A strategy can shed low‑intent sessions while improving commercially important paths, so the dashboard needs attribution and lead‑quality context before labeling the trend good or bad.