SEO Automated Reporting: Tools, Metrics, and Dashboard Setup

Key Takeaways
- Automated SEO reporting creates a continuous optimization loop, updating keyword rankings daily.
- The core KPI set has four metrics: keyword rankings, organic traffic, backlink health, technical alerts.
- Daily or weekly ranking updates let the AI writer re-target slipping terms automatically.
- Dashboard deployment takes a few hours for basic integrations.
- Adding secondary tools can take several days.
- Automated reporting eliminates spreadsheet juggling.
- SEO teams report spending 70% more time on strategic analysis.
- Monitoring new and lost backlinks gives the AI engine authority signals.
Quick Summary
SEO automated reporting pulls rankings, traffic, and backlink data into one scheduled view. You stop juggling spreadsheets and start making strategic decisions. When the data lands in a live dashboard, AnyPost can use those signals to guide content updates. It can adjust keyword focus, expand topical depth, or refine brand voice. This continuous optimization loop keeps the content pipeline responsive to search performance.
When the reporting feed reaches the AI writer, the system surfaces which phrasing drives clicks. It also shows which keywords gain traction and how brand voice resonates. That feedback shortens revision cycles and supports steady organic growth.
What metrics should you prioritize?
The core KPI set keeps the dashboard tight and readable.
- Keyword rankings – daily or weekly updates let the AI re-target slipping terms.
- Organic traffic – sessions and users from Google Search show real-world impact.
- Backlink health – new and lost links inform authority signals the engine can weigh.
- Technical alerts – crawl errors or index issues trigger immediate content fixes.
“Automated SEO reporting changes the way we analyze performance, allowing us to focus on strategy rather than manual data collection.” – SEO Expert
How long does it take to get a dashboard running?
Dashboard setup depends on connected data sources and customization needs. A basic configuration with Google Search Console and Google Analytics can move quickly. Adding secondary tools, backlink providers, site-audit platforms, or multi-client views takes more time and planning.
Which tool characteristics matter most?
Choosing a reporting solution comes down to how well it feeds data into an AI content engine. Here's a side-by-side view of three generic options that meet that criterion.
| Tool | Data sources integrated | Report frequency options | Setup complexity | Highlight |
|---|---|---|---|---|
| Tool A | > 50 platforms (incl. Analytics, keyword tools) | Daily, weekly, monthly | Intermediate | Direct connectors keep data latency low |
| Tool B | > 30 popular marketing platforms | Weekly, monthly | Beginner‑friendly | Drag‑and‑drop widgets simplify dashboard design |
| Tool C | > 1,000 sources via universal connector | Real‑time, custom intervals | Advanced | Broad ecosystem supports niche metrics |
Why this matters: A tool that refreshes data frequently, daily for example, lets the AI engine react to ranking shifts faster. Platforms with less frequent updates still automate reporting, but they may lag behind fast-moving SERP changes. In practice, starting with a daily refresh for core keywords and scaling to real time for high-value pages gives you a balanced approach.
Align the metrics you track, the time you invest, and the tool's integration depth, and you get a self-optimizing pipeline. The dashboard surfaces performance gaps. The AI writer rewrites or expands content. The next report confirms the impact.
Why SEO Automated Reporting Matters
Automated dashboards replace manual data pulls. Teams get more time each week to plan, create, and refine content.
We schedule reports to run daily or weekly. They pull from Google Search Console, Google Analytics, and other SEO tools without human intervention. Because the data arrives pre-aggregated, analysts skip the copy-paste routine. They can quickly spot trends. The saved hours let us allocate resources to deeper audience research, A/B testing headlines, or expanding topical clusters. These activities directly influence rankings.
What impact does real-time data have on content optimization?
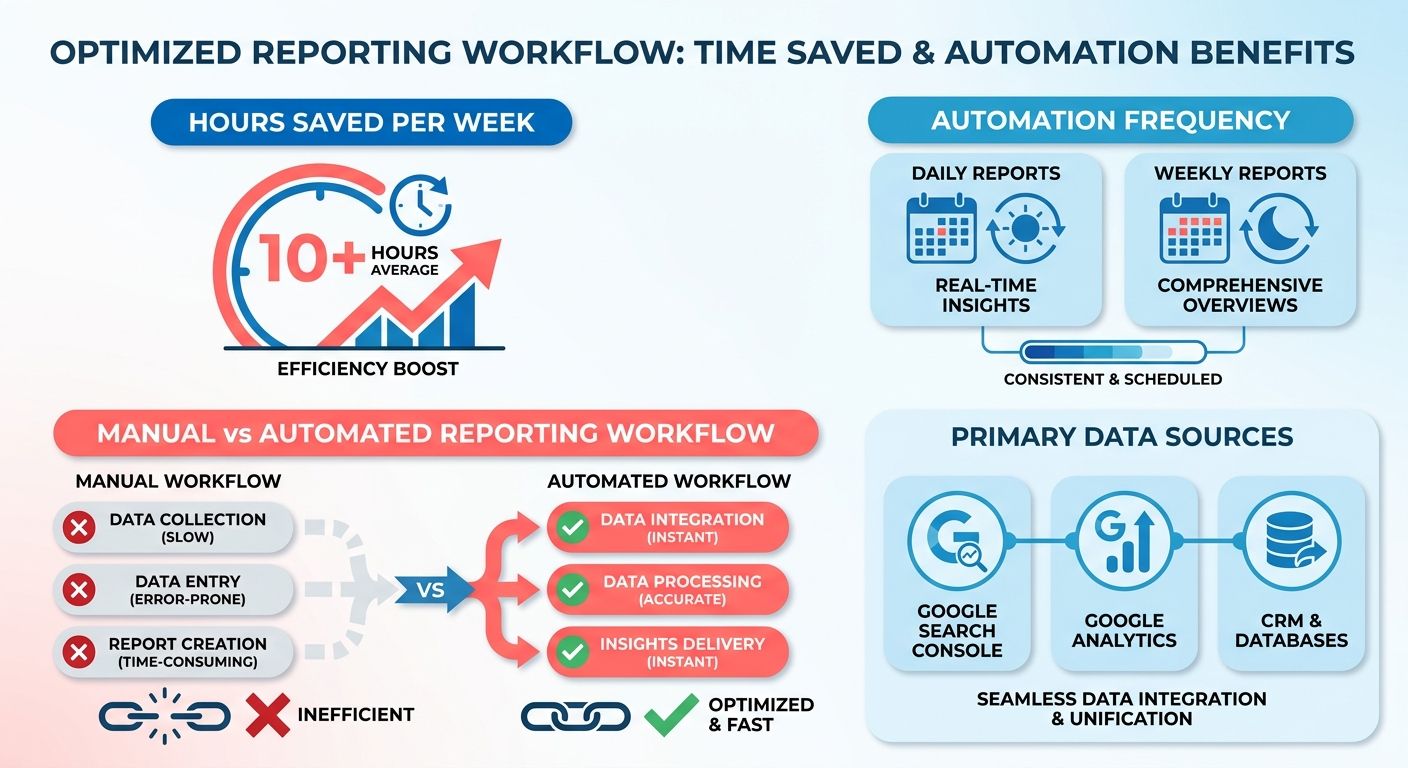
Real-time metrics let the AI engine adjust keyword focus, tone, and structure. Published pieces stay aligned with evolving search intent.
When the automated report flags a rise in a long-tail term, our content generator rewrites sections to include it naturally. That preserves brand voice while capturing fresh traffic. If the report highlights a technical SEO issue, the system alerts the team before rankings suffer. This feedback loop keeps content fresh and accurate.
“Automated reporting isn't about replacing human insight—it's about amplifying it so marketers can focus on strategy rather than spreadsheets.” – Rand Fishkin
We agree: automation handles the data collection, but interpretation still rests with our team. Machines gather and surface signals. Humans decide how to act on them.
When might automated reporting be the wrong fit?
If your SEO program relies on ad-hoc one-off queries, scheduled reports may add unnecessary overhead.
Teams managing a single site with static keyword targets often find manual checks sufficient. The ROI of a full automation stack drops sharply. In those cases, we recommend a lightweight dashboard that tracks only the essential KPIs: rankings and traffic. Leave out technical audits and AI-driven content loops. That keeps the system lean while preserving consistency.
By pairing SEO automated reporting with AnyPost.ai's AI-powered content engine, we turn raw numbers into a useful editorial guide. The process refines voice, keyword focus, and ranking potential. It supports organic growth that static reporting cannot match.
Choosing the Right SEO Automation Tool
We look for a tool that turns SEO automated reporting into a live data source for our AI content engine, not a static PDF. When a dashboard provides up-to-date rankings, traffic, and visibility metrics from Google Search Console and Google Analytics, we can use those insights to guide the next round of content creation.
What core features should we look for?
A strong automation platform must aggregate multiple data sources (GSC, GA4, backlink databases) and schedule updates without manual clicks. Agencies that connect all three once and let the system refresh daily report noticeable savings in analyst time, according to industry studies. We also require customizable metrics—traditional rankings plus AI-search-visibility scores—because a dashboard that only shows clicks and impressions leaves out useful nuance.
“Automated reporting changes the way we analyze performance, allowing us to focus on strategy rather than manual data collection.” – SEO expert quoted in an industry blog
When a tool lets us define KPI groups and visually filter them, we can quickly spot a dip in a high-value keyword. Then we can update the headline or angle of the next article.
How do pricing models affect scalability?
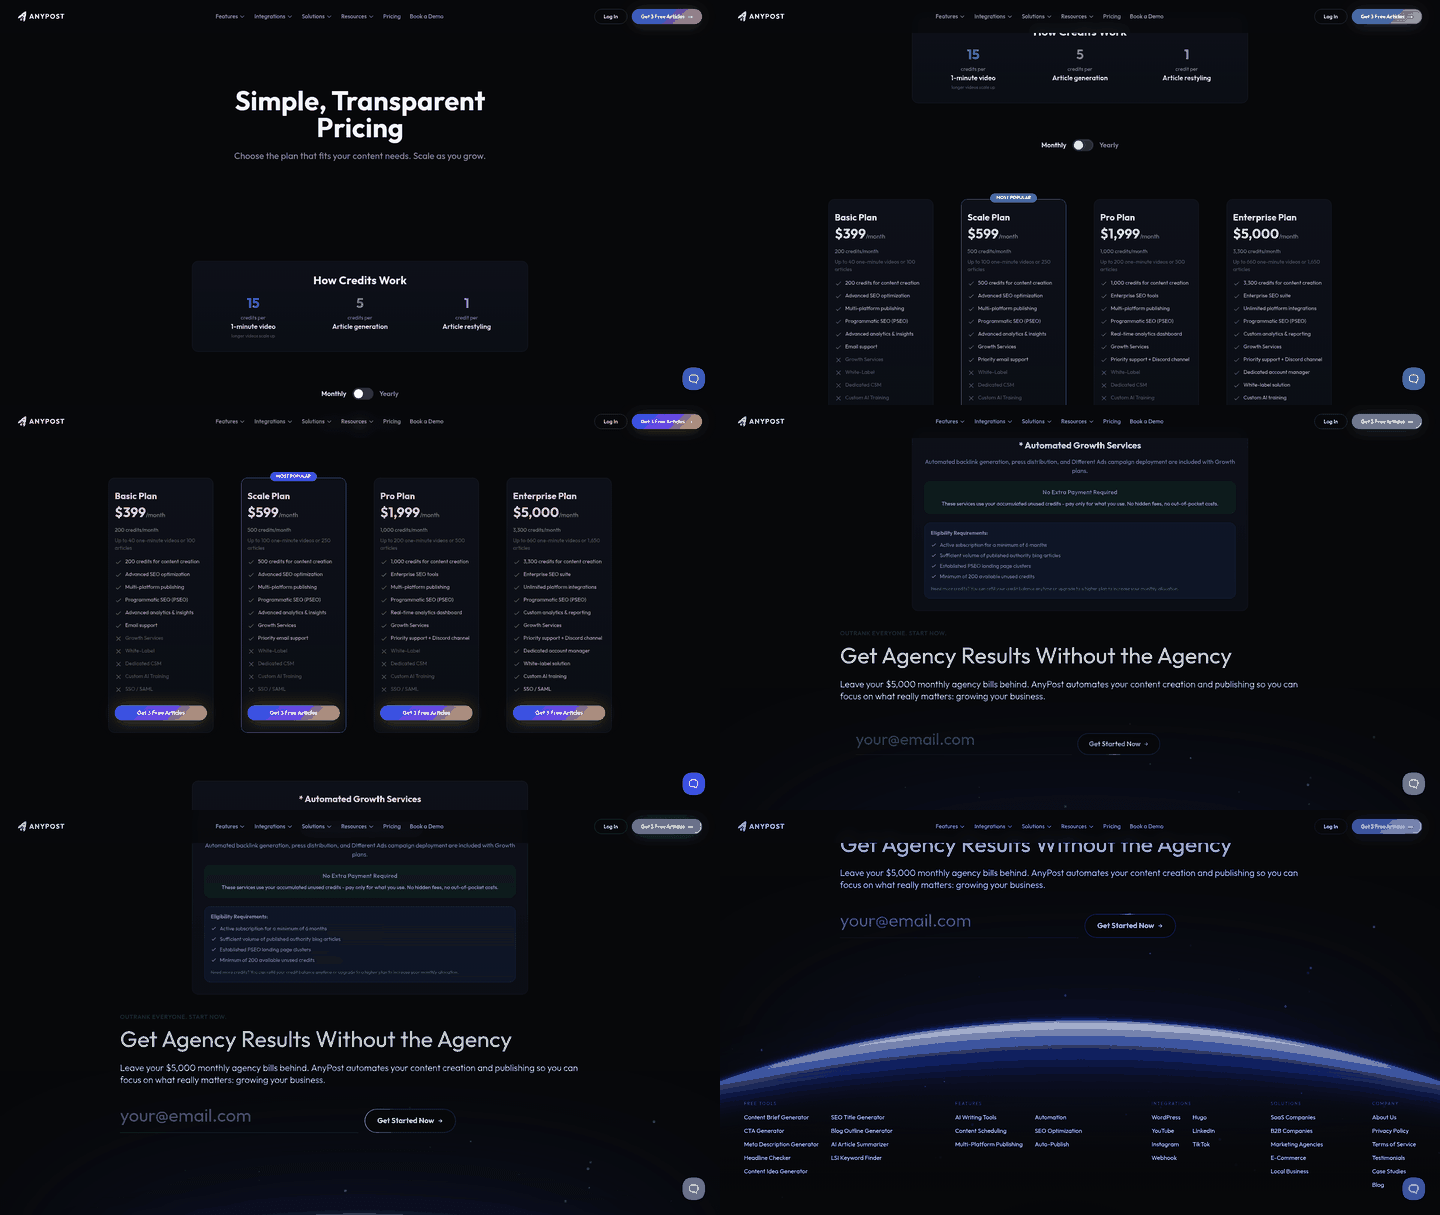
Monthly subscription plans work well for agencies handling dozens of clients. The predictable cost aligns with the time savings reported across the sector. One-time licenses may look cheap upfront, but they often lack the continuous data-refresh APIs that power an ongoing optimization workflow. That can force teams to rebuild connectors regularly. In practice, many agencies find that moving to a flat-rate subscription frees up bandwidth for strategy work and lets them serve more clients.
Which integrations enable the continuous optimization workflow?
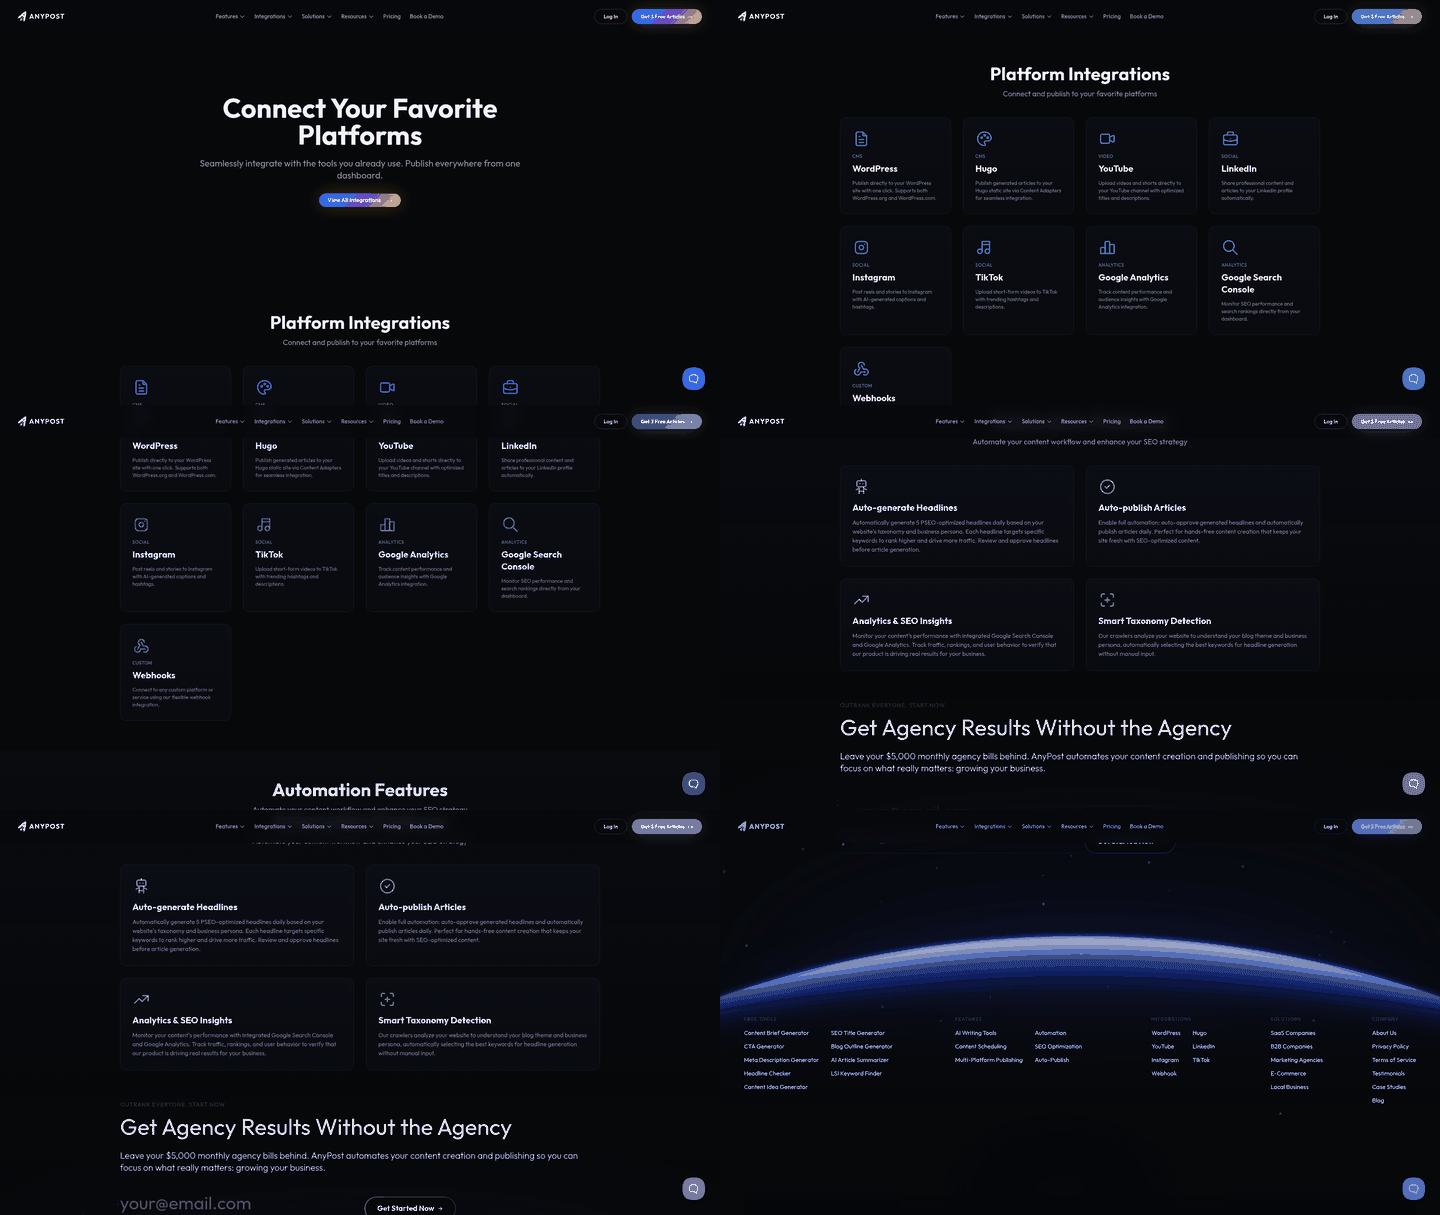
The workflow becomes efficient when the reporting engine talks directly to the AI writer. We integrate Google Analytics and Search Console via native connectors, avoiding third-party middleware that adds latency. A dashboard that updates on a regular schedule, similar to the refresh rate of leading data-studio solutions, feeds the content team with fresh click-through rates and impression trends. While AnyPost.ai doesn't automatically rewrite meta descriptions, the up-to-date data lets creators manually adjust on-page keyword focus and meta tags to match emerging search intent.
If you're using a tool that only exports CSVs for manual upload, you'll miss the feedback loop that keeps the AI-assisted process aligned with performance data. That's why we favor platforms that support API-driven reporting and scheduled delivery. Data collection, insight generation, and content creation stay connected.
When should you skip a tool?
If your team manages fewer than five pages or relies on quarterly SEO audits, the overhead of a full-stack automation platform may outweigh the benefit. In those cases, a simple spreadsheet may be sufficient. The continuous loop we champion would add unnecessary complexity.
By focusing on these criteria—multi-source aggregation, scalable pricing, and tight integration with our AI writer—you ensure the chosen SEO automation tool fuels a continuous optimization workflow that keeps content aligned with search performance, far beyond what standard reporting dashboards deliver.
Setting Up Your SEO Dashboard
A clean layout groups related metrics, uses whitespace strategically, and lets you spot trends quickly.
We start by dividing the canvas into three vertical zones: acquisition, performance, and conversion. The left column shows raw traffic and click-through data. The middle column visualizes ranking movements. The right column highlights revenue-related outcomes. By keeping each zone to a single visual type, we reduce cognitive overload and make it easy for stakeholders to find the data they need.
Which visualizations communicate SEO health best?
Line charts for trends, bar graphs for comparisons, and heat maps for geographic insights deliver the most actionable signals.
For keyword rankings, we prefer a multi-line chart that tracks the top 10 keywords and their weekly position changes. That lets the AI engine surface upward or downward momentum without manual filtering. Traffic sources work well in stacked bar graphs, while a world-map heat layer reveals regional search spikes that can inform localized content ideas. Clear visualizations help teams focus on strategy rather than data assembly.
Where should you place core KPIs for maximum impact?
Prioritize rankings, organic traffic, and conversion-rate KPIs at the top of the dashboard. Layer secondary metrics below.
The top-most row should feature three large, color-coded cards: Keyword Ranking Score, Organic Sessions, and Goal Conversions. Because these cards update in real time, AnyPost's analytics can highlight any deviation for the content team to review. A dip in the ranking score, for example, prompts a recommendation to enrich the target page's topical depth. Below the primary cards, place secondary KPIs such as Backlink Health, Crawl Errors, and Site Visibility. These support deeper analysis without cluttering the headline view.
When to skip this level of detail: If your team doesn't integrate an AI content engine, a minimalist dashboard tracking only traffic and rankings may be sufficient. The additional layers of AI-informed insights become most valuable when there's a downstream system to act on the recommendations.
By following these layout, visualization, and KPI-placement principles, you turn raw SEO automated reporting data into a useful engine that refines content, supports ranking growth, and scales efficiently for any growth-focused organization.
Automating Your SEO Reports
We schedule SEO performance monitoring to align with your content publishing cadence. That lets you view key metrics alongside the AI-generated articles in AnyPost.ai's analytics dashboard. The platform connects to common data sources such as Google Search Console and Google Analytics, so you can track rankings, traffic, and engagement without leaving the interface. Its AI engine surfaces content opportunities based on observed trends, helping you prioritize the next piece of copy.
How often should reports refresh to keep the loop alive?
A refresh interval of daily often provides a good balance between data freshness and API limits. Daily updates capture ranking movements that typically shift over 24-hour periods, while still respecting rate-limit constraints. If you need to monitor high-priority pages more closely, you can configure a shorter cadence for those assets and a longer interval for the rest.
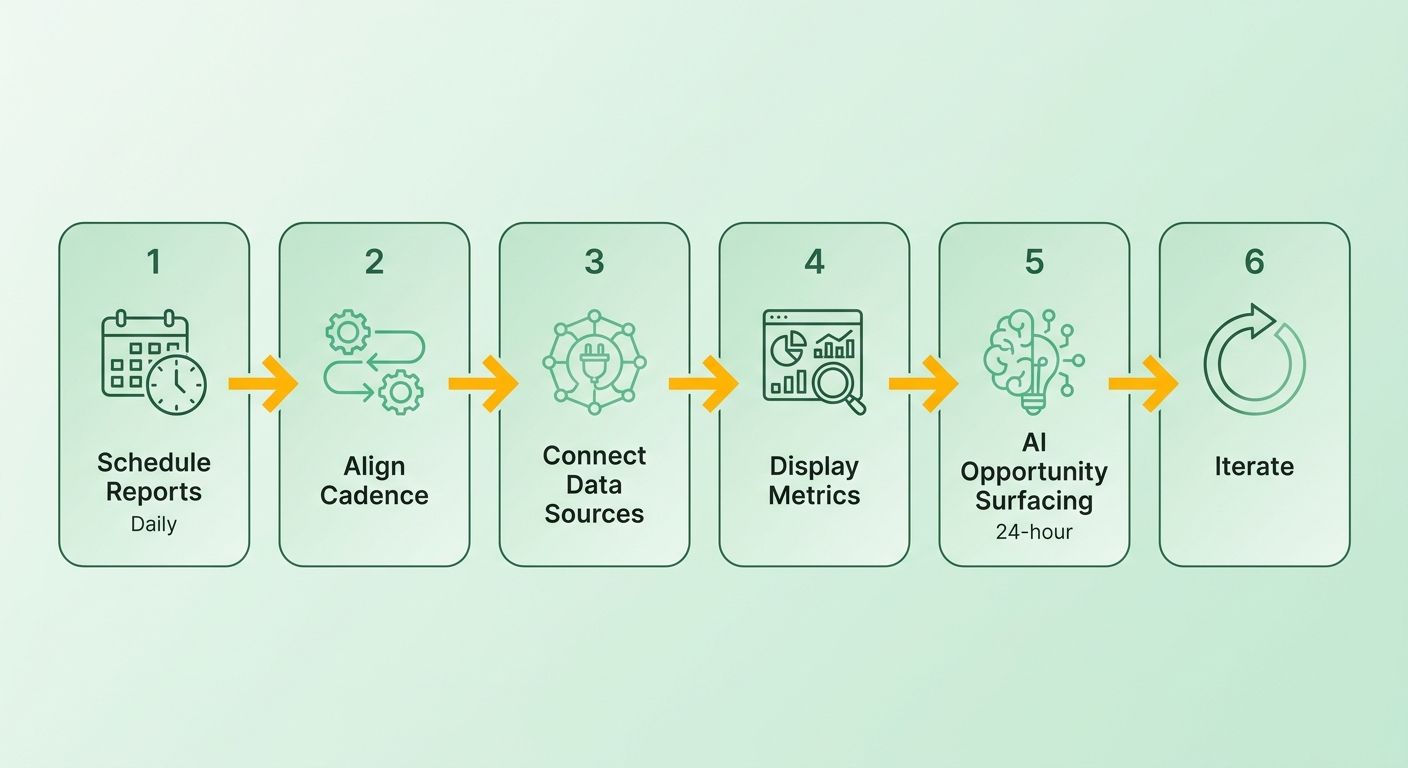
We configure the refresh schedule in the analytics settings and enable the appropriate API tokens for your data sources. After the data lands, you can set up automations that trigger updates to the next-generation brief or alert you to significant changes in keyword performance. If you encounter API-quota warnings, consider extending the interval to 12 hours for non-critical pages.
Which delivery methods keep stakeholders in the loop without overload?
Stakeholders can access performance insights directly through the live dashboard or receive concise email summaries that highlight top-ranked keywords and any alerts. The dashboard lets analysts and clients explore deeper trends on demand, reducing the volume of "can you send me the latest numbers?" requests. You can also customize views so executives see high-level KPIs while writers see keyword-level insights.
Set up role-based access in the platform, mapping each recipient to the appropriate view. Keep daily alerts lightweight—just a few bullet points with a link to the live view—to prevent inbox fatigue while still providing the data needed for action.
What scheduling setup maximizes the continuous-optimization loop?
A practical approach is to review daily metrics for quick adjustments and conduct a weekly deep-dive to inform longer-term strategy. The daily check captures immediate performance signals, while the weekly analysis aggregates month-over-month trends and helps you refine content plans.
When configuring the schedule, start with a default "every 24 hours at 02:00 UTC" to avoid peak API traffic, then adjust based on the time zone of your primary audience. Pair the schedule with alert thresholds, such as a 5% drop in top-10 rankings, so the AI only suggests content revisions when the signal is strong enough to merit effort. This cadence keeps the feedback loop responsive to market shifts while grounding recommendations in reliable data.
Measuring the Success of Your SEO Automated Reporting
We focus on three data families—efficiency, accuracy, and business impact—to know whether the automation delivers value.
- Time saved – automation reduces the manual effort required for reporting, freeing teams to concentrate on strategy and creative work.
- Report accuracy – built-in validation checks keep the automated outputs closely aligned with source data, helping catch discrepancies early.
- Business growth – monitor organic-traffic lift, conversion uplift, and revenue tied to the keywords highlighted in the report.
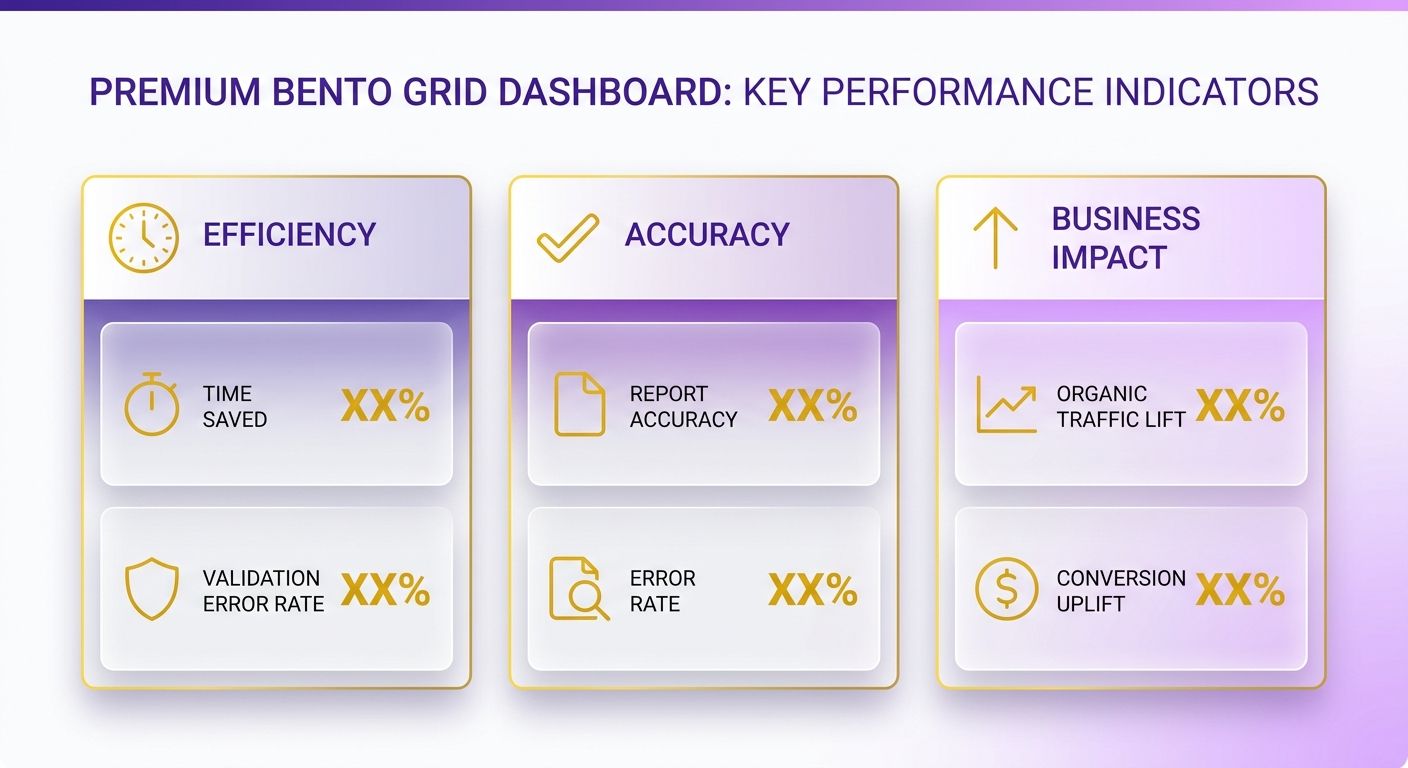
By visualizing these metrics on a single dashboard, we spot trends quickly and let the AI engine adjust phrasing or keyword density for the next content cycle.
How do you calculate ROI for SEO automated reporting?
ROI comes from the dollar value of saved labor plus the incremental revenue generated by higher rankings.
- Quantify labor savings – estimate the reduction in reporting hours and multiply by your team's average hourly cost to calculate cost avoidance.
- Add revenue lift – attribute a portion of any observed traffic or conversion improvements to the automated insights, then apply your average revenue-per-visitor figure.
- Combine and compare – total the estimated weekly benefit and compare it to the subscription cost to see the ROI multiple.
“Automated reporting isn't about replacing human insight—it's about amplifying it so marketers can focus on strategy rather than spreadsheets.” – Rand Fishkin, Founder of SparkToro
When the ROI number exceeds the breakeven point, the loop is paying for itself, and you can justify expanding the automation cadence.
How do you ensure data accuracy and handle errors?
We embed validation checkpoints and alerting so a single glitch never contaminates the feedback loop.
- Data cleaning – normalize metric units (e.g., clicks vs. impressions) and strip duplicate rows before they hit the dashboard.
- Normalization rules – enforce consistent naming for campaigns and keywords. GA4 tracks a wide range of metrics, so we map each to a unified schema.
- Error alerts – set up real-time notifications when API responses return null or when a report's variance exceeds an acceptable tolerance.
- Error logs – maintain a rolling log of failed pulls. Weekly reviews let us patch API limits or credential expirations before they affect the AI engine.
If a discrepancy appears—say the GSC click count diverges from GA4 sessions—we cross-check both sources, flag the outlier, and trigger a manual audit. This disciplined approach keeps the data feed clean and prevents the AI from learning from faulty signals.
Continuous improvement tips
- Iterate on KPI selection – revisit the three metric families each quarter. Drop stale indicators and add emerging ones like search-intent clusters.
- Run A/B content tests – let the AI generate two headline variants, then feed the click-through results back into the reporting engine for the next cycle.
- Survey clients regularly – use a short NPS-style question plus an open-ended prompt. Track the average score and the percentage of "actionable" comments. A steady rise in satisfaction confirms the loop is delivering perceived value.
By treating the reporting system as a living data source rather than a static deliverable, we keep the AI content engine tuned to what actually moves the needle. Our clients see measurable gains in both performance and confidence.
Frequently Asked Questions
Q: What is SEO automated reporting? A: It's a system that pulls keyword rankings, traffic, backlink data, and technical alerts into a single dashboard on a scheduled basis—daily, weekly, or monthly—so you don't have to manually compile reports from multiple sources.
Q: How does automated reporting improve content strategy? A: When the reporting feeds into an AI content engine, the system can surface which keywords are gaining or losing traction. That lets writers adjust focus, expand topics, or refine brand voice based on real performance data rather than gut feel.
Q: What metrics should I track in my SEO dashboard? A: Start with keyword rankings, organic traffic, backlink health, and technical alerts. Those four give you a complete picture of content performance without dashboard bloat.
Q: How long does it take to set up an automated SEO dashboard? A: A basic setup with Google Search Console and Google Analytics takes a few hours. Adding secondary tools like backlink databases or site-audit platforms pushes that to several days.
Q: Can automated reporting work for small teams? A: Yes, but only if you have enough content to justify the setup overhead. Teams managing fewer than five pages or relying on quarterly audits may find manual checks sufficient.
Q: How often should reports refresh? A: Daily is the sweet spot for most teams. It captures ranking shifts that happen over 24-hour periods without hitting API rate limits. High-priority pages can refresh more frequently.
Q: What's the ROI of automated SEO reporting? A: It comes from two places: labor savings, meaning fewer hours spent on manual data collection, and revenue lift, meaning higher rankings from faster content adjustments. Most teams see positive ROI within the first quarter.
Q: How do I ensure data accuracy in automated reports? A: Set up validation checkpoints that normalize metric units, strip duplicates, and flag outliers. Real-time alerts for API failures or data discrepancies let you catch problems before they affect the AI engine.
Q: What tools work best for SEO automation? A: Look for tools that support API-driven reporting, connect to multiple data sources, and offer daily refresh options. The ability to feed data directly into an AI content engine is the differentiator.
Q: How do I present automated reports to stakeholders? A: Use a live dashboard for analysts and executives who want to explore trends. Send concise email summaries with top-ranked keywords and alerts to everyone else. Role-based views let each person see what matters to them.
References
[1] Automated SEO Reporting: The Complete Guide - https://ahrefs.com/blog/seo-reporting/
[2] Google Search Console Performance Report Documentation - https://developers.google.com/search/docs/data-types/performance-report
[3] Google Analytics 4 Reporting Overview - https://support.google.com/analytics/answer/9212670
[4] SEO Reporting Metrics That Matter - https://moz.com/blog/seo-reporting-metrics
[5] Automated SEO Reports: Tools and Best Practices - https://www.searchenginejournal.com/seo-reporting-tools/
Frequently Asked Questions
1. How can I connect an SEO reporting tool to an AI content platform without writing custom code?
You can link an SEO reporting service to an AI writer via native API connectors or webhook integrations that push rankings, traffic, and backlink metrics straight into the writer’s data layer. Most SaaS solutions, including AnyPost.ai, provide pre-built connectors for Google Search Console and Analytics, removing the need for custom development.
2. What are the trade-offs between daily and real-time data refreshes for ranking alerts?
Daily refreshes give you fresh ranking snapshots while keeping API usage low; real-time updates surface SERP shifts instantly but consume more quota and may introduce latency. Choose daily pulls for most keyword groups and reserve real-time streams for high-value pages where a few minutes of delay could affect traffic.
3. Which organizations benefit most from a multi-source dashboard versus a single-source view?
Agencies handling multiple clients gain the most from a multi-source dashboard because it consolidates GSC, GA4, and backlink data in one view, reducing duplicate work. Small businesses with a single site often prefer a single-source setup, which is quicker to deploy and easier to maintain.
4. How should I set alert thresholds to avoid false positives in automated SEO reports?
Set alert thresholds based on historical volatility. For example, trigger a warning when a top-10 keyword drops more than three positions in 24 hours or when click-through rate falls below a 10 % change from its 7-day average. This balances sensitivity with noise reduction.
5. Can automated reporting be used for multilingual sites, and what extra steps are required?
Automated reporting can handle multilingual sites, but you must map each language’s property in Search Console and create separate KPI groups per locale. The dashboard should filter rankings and traffic by language code, and the AI writer must receive the appropriate dataset to generate localized suggestions.
6. What pitfalls arise when relying solely on automated reports for technical SEO fixes?
Relying only on automated reports for technical fixes can miss nuanced crawl errors that require manual inspection. Use the alerts as a first-line signal, then verify each issue in Google Search Console or a site-audit tool before deploying changes. This two-step validation prevents unnecessary updates.