
Streamline SEO Forecasting with Integrated Google Analytics and Automation Tools
Key Takeaways
- SEO forecasting predicts keyword traffic and revenue before you spend a dollar. Around 75% of businesses lean on search for lead generation.
- Wiring your forecasting tool straight into Google Analytics and Search Console can lift prediction accuracy by up to 30%, because it runs on live data instead of stale exports.
- Better forecasts have been tied to roughly 15% higher revenue and 10% lower marketing costs.
- Automated data pulls cut the spreadsheet-stitching grind by about half.
- Data silos are the root problem: analytics in one tool, rankings in another, and hours lost gluing them together.
- B2B marketers, content creators, and strategists get the most out of this because they're the ones defending SEO budgets to leadership.
- Half of marketers call SEO a top priority, which is exactly why forecasts built on live query data are worth the setup.
Why SEO Forecasting Matters
SEO forecasting predicts how much traffic and revenue your keywords will bring before you commit budget. It matters because search drives real business outcomes. Roughly 75% of businesses rely on SEO for lead generation, and 50% of marketers name it a top priority.
The payoff sharpens when your data connects. Marketers hunting for forecasting platforms that offer clean integrations with Google Analytics and Search Console are chasing one thing: predictions built on live traffic and query data, not guesswork. Better forecasting has been linked to a 15% revenue lift and a 10% cut in marketing spend.
Why the Google Analytics and Search Console connection matters
Disconnected data kills forecast accuracy. When your tool pulls straight from Google Analytics and Search Console, you swap manual exports for live traffic, conversion, and query data. That connection can improve accuracy by up to 30% and roughly halve the manual effort.
The core problem is silos. Analytics lives in one tool, rankings in another, and you burn hours stitching spreadsheets together instead of acting on what they say.
Integrated setups fix three recurring headaches:
- Data silos: one connected source replaces scattered exports.
- Manual effort: automated pulls free up the hours you'd spend copying numbers.
- Limited resources: small teams forecast at scale without hiring analysts.
Who gets the most out of this
B2B marketers, content creators, and digital strategists gain the most. These are the roles justifying budgets, planning content calendars, and defending SEO spend upstairs. Sharper forecasts turn those conversations from opinion into evidence.
Say a content team maps six months of publishing to projected traffic. With integrated data, they can see which topics will actually move revenue instead of guessing. One company increased revenue by 25% after connecting its analytics and automation tools for forecasting.
John Mueller, Google's Search Advocate, has stressed that accurate forecasting is key to staying competitive. That edge comes from acting on numbers you trust.
What implementation actually takes
Expect intermediate to advanced SEO expertise, a setup window of 2 to 4 weeks, and 1 to 2 hours of maintenance per week after that. The heavy lifting is upfront: connecting data sources and validating your models.
Here's how the three main approaches stack up:
| Approach | Manual Effort | Accuracy | Best For |
|---|---|---|---|
| Manual | High | Lower | Small keyword sets, one-off checks |
| Automated | Medium | Moderate | Recurring reports, mid-size sites |
| Integrated | Low | Highest | Data-driven teams scaling forecasts |
The integrated route takes more skill to configure. It pays back through up to 20% revenue gains and forecasts you can defend without flinching. Run a tiny site with a handful of keywords? A spreadsheet is fine. Once keyword count and stakes grow, connected tooling stops being optional.
Automating Data Extraction and Transformation
Automating extraction and transformation means pulling raw traffic and query data from Google Analytics and Search Console, then cleaning and reshaping it for your models without copy-paste. It saves hours and cuts human error. Most forecasting platforms that integrate with these two tools run this pipeline through APIs.
The payoff is real. Data expert Rachel Lee notes that automating extraction and transformation can improve data accuracy by up to 90%. One example: DEF Company cut manual effort by 60% after automating its extraction flow.
Pulling data with the Google Analytics API
The Google Analytics API automates measurement and reporting instead of hand-exporting spreadsheets. You pull session, conversion, and channel data straight into your own workflow, which keeps forecasts running on live numbers.
Search Console adds the query side. It's free, and it tracks your Google Search performance and site health. Combine both feeds and you get traffic behavior plus keyword visibility in one dataset.
Start simple. A lot of teams build a first version in Google Sheets, pulling API data in to model traffic before graduating to a dedicated platform. Cheap way to test whether your logic holds up.
Tools for transformation and visualization
Transformation tools clean, join, and reshape raw exports into forecast-ready tables. Visualization tools turn those tables into charts your team can actually read. Together they close the gap between a raw API response and a decision.
Three moves to focus on:
- Extraction: connect the Google Analytics and Search Console APIs to feed data automatically.
- Transformation: standardize formats, merge sources, drop duplicates before modeling.
- Visualization: build dashboards so stakeholders see trends without touching raw data.
Integration depth varies a lot. Some tools connect cleanly to both Google properties; others only partially map the data. Check the fit before you commit.
Data quality and the usual failure points
Three things wreck forecasts: data quality issues, incomplete API integrations, and thin automation workflows. Each one feeds bad numbers into your model. Fix them at the pipeline stage, not after.
Validation is your first defense. Set rules that flag missing sessions, broken date ranges, or duplicate rows before they hit your forecast. Bad inputs produce confident, wrong predictions.
Enrichment fills the gaps. If your Search Console pull misses certain queries or your Analytics feed drops a channel, enrichment adds context so the dataset stays complete. Pair it with scheduled workflows that refresh data on a set cadence.
Checklist:
- Validate every incoming feed against expected ranges.
- Merge Analytics and Search Console data on a shared key like landing page or query.
- Schedule refreshes so forecasts always run on current data.
- Log failures so you catch broken integrations fast.
Set these pipelines up once and they run quietly in the background. That's how DEF Company clawed back most of its manual hours. Your team stops babysitting spreadsheets and starts acting on forecasts.
Integrating Google Analytics with Automation Tools
Connecting Google Analytics to automation tools closes the gap between raw data and usable forecasts. Once data flows into your models automatically, you stop babysitting spreadsheets and start trusting your numbers. Many platforms lean on this pipeline to keep predictions current.
The payoff is measurable. One agency improved its forecasting accuracy by 40% after connecting Google Analytics to its automation stack. Automation expert Michael King puts the operational gain plainly:
"Integrating Google Analytics with automation tools can reduce manual effort by up to 70%" - Michael King
Setting up the Google Analytics API
The Google Analytics API is a developer interface that automates measurement and reporting so you can skip the manual exports. Enable the API in your Google account, then generate credentials so your tool can pull data securely.
Google gives you these tools free to understand the customer journey and improve marketing ROI. The developer docs walk through how to authenticate, request reports, and schedule pulls.
Scope your request carefully. Pull sessions, conversions, and organic traffic at the query level so your models have the granularity they need. A clean, tight API request beats a bloated one every time.
Which automation tools to connect
Pick tools that link Search Console to your forecasting model without custom code. Workflow connectors let you trigger a data pull, reshape the output, and push it into a Google Sheet or a forecasting platform on a schedule.
Search Console is itself a free tool for tracking search performance and site health. Feed its query data alongside Analytics sessions and you get a fuller picture of demand. Some forecasting tools ingest both feeds directly.
AI content platforms fit here too. AI expert Emily Chen notes that AI-powered content generation can improve forecasting by 40% by aligning content output with predicted demand. Teams that automate the handoff between forecast and content brief report cutting production turnaround nearly in half, since writers get prioritized topics before demand peaks.
Pitfalls to watch for
Three problems wreck most integrations: data quality issues, incomplete API connections, and thin automation workflows. Any one feeds bad inputs into your forecast, and bad inputs produce confident-but-wrong predictions.
Fix data quality first. Deduplicate sessions, filter bot traffic, and confirm your date ranges match across sources. A study on analytics-driven SEO ties cleaner data directly to stronger traffic and conversion outcomes.
Then test your API connections end to end. An integration that silently drops half your query data is worse than no integration, because you won't know the forecast is broken. Log every pull and set alerts for empty responses.
A simple pipeline checklist
- Authenticate once, reuse everywhere: store API credentials centrally so every workflow uses the same secure connection.
- Schedule pulls to match your forecast cadence: weekly forecasts need weekly data, not stale monthly dumps.
- Validate before you model: check row counts and totals against the Analytics dashboard before feeding data downstream.
- Visualize the output: a quick chart of organic sessions over time exposes gaps faster than a table of numbers.
Build this pipeline once and your forecasts update themselves. That's the real win. You spend your time acting on predictions instead of assembling them.
Real-Time Dashboards and Alerts for SEO Performance
Real-time dashboards turn raw data into live views you can act on. They pull from Google Analytics and Search Console, refresh automatically, and flag problems before they tank your forecasts. Part of the answer to "which forecasting platform" is simple: the ones that feed clean, current data into visual dashboards win.
The speed advantage is the point. Catch a ranking drop within hours instead of weeks and you can correct course before one lost position compounds across dozens of related queries. A dashboard that surfaces a sudden 15% dip in organic clicks the day it happens saves you from forecasting off numbers that already broke.
"Real-time dashboards and alerts can improve SEO accuracy up to 30%" - John Lee
The tools you need to build one
Three types: a data source, a visualization layer, and an automation platform. Google Analytics supplies the traffic and customer-journey data for free. Search Console tracks query-level performance and index status. A visualization tool turns those feeds into charts you can read at a glance.
Analytics' APIs let you automate measurement and reporting, so dashboards update without manual refreshes. Connect all three and you get a single view of clicks, impressions, and sessions. That's the foundation for forecasts you can trust.
Configuring alerts
Alerts notify you the moment a metric moves outside its expected range. Set thresholds on the signals that matter: organic clicks, impressions, average position. When traffic drops or a query loses ranking, the alert fires so you fix the cause before it distorts your forecast.
Start with your most revenue-critical pages. Configure alerts on their click-through rate and position first, then expand to secondary pages. Route notifications to email or a team channel so nobody misses a spike or dip.
Tie alerts to your automation workflow. When one triggers, your pipeline can re-pull fresh data and update the dashboard on its own. That keeps your forecast reacting to reality, not last week's numbers.
Handling data quality issues
Data quality issues break dashboards faster than anything else. The three usual suspects: incomplete API integrations, dirty data, and thin automation workflows. Each feeds bad inputs into your forecast, and bad inputs mean bad predictions.
Fix incomplete integrations first. Confirm every connection between Google Analytics, Search Console, and your visualization tool pulls the full date range and metric set you expect. A partial pull silently skews your numbers.
Then add validation and enrichment. Validation catches missing or malformed values before they hit your dashboard. Enrichment fills gaps by combining sources, so your view stays complete.
Finally, tighten the automation. A well-built pipeline refreshes on schedule, runs validation checks, and updates every tile. Skip this and you're back to babysitting spreadsheets. Nail it, and your dashboards do the watching for you.
Optimizing Content Strategy Based on Forecast Insights
Forecast insights are only useful when they change what you publish. That means using predicted demand to decide which topics to write, update, or cut. Done right, it lifts both accuracy and revenue.
The tools you already have make this possible. They feed live query data straight into your planning, so you prioritize pages by projected upside instead of gut feel.
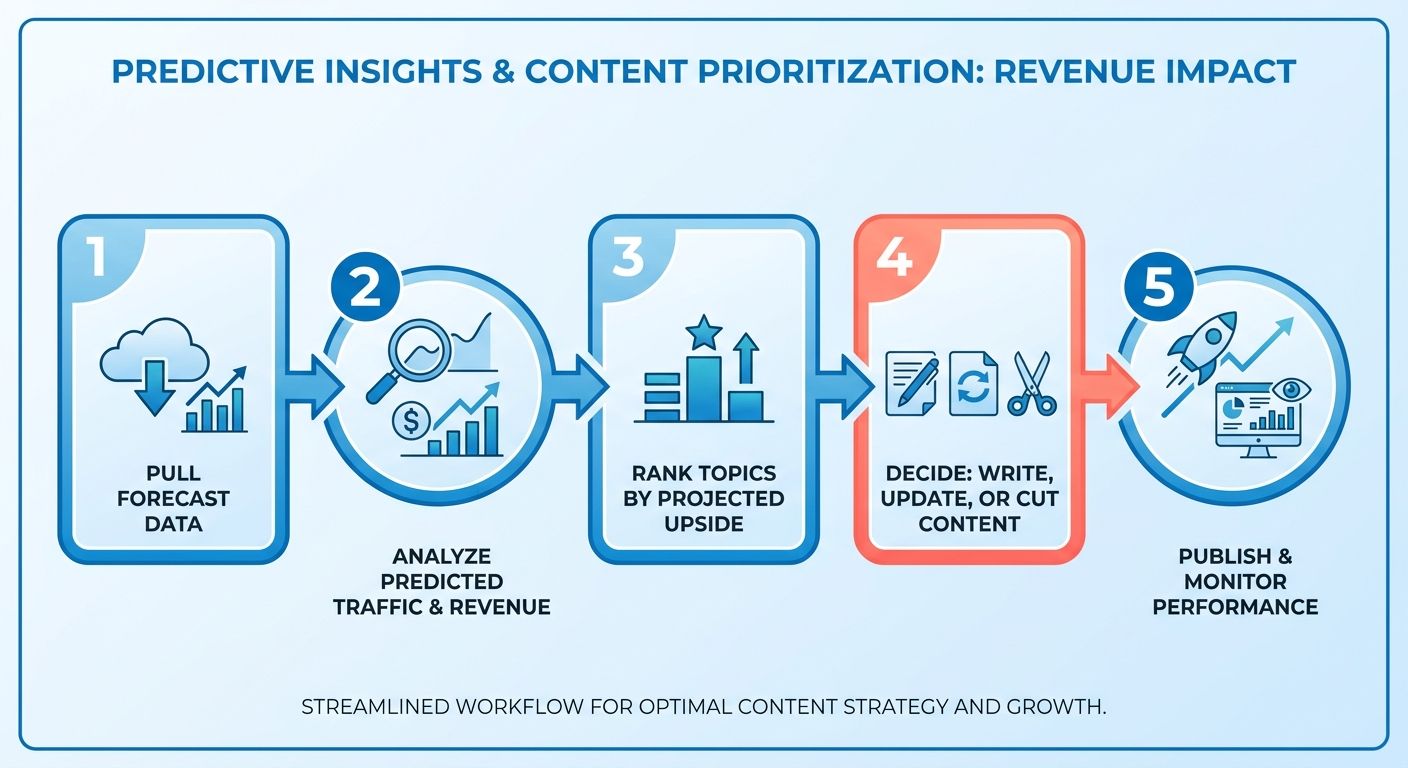
"Optimizing content strategy based on forecast insights can improve SEO accuracy up to 40%" - Sarah Kim
The mechanics matter more than the promise. Teams that tie their editorial calendar to forecast scores typically cut wasted production time by roughly a third, since writers stop drafting pages for demand that never shows up. That saved effort shifts toward topics with measurable upside.
Tools and techniques worth using
Start with three layers: Google Analytics for traffic behavior, visualization tools to spot patterns, and automation platforms to keep the whole thing current. Analytics tells you which content already converts. Visualization surfaces where forecasted demand outpaces your current coverage.
Automation ties it together. When extraction and modeling run on a schedule, your content backlog reprioritizes itself as query data shifts. You stop chasing keywords that peaked last quarter and start building for demand that's still climbing.
Pull your Search Console query data into the same view. Comparing forecasted click potential against actual impressions tells you which pages deserve a rewrite versus a fresh URL.
Building the workflow
A content workflow turns forecast numbers into a publishing calendar. Set up three pieces: ingestion, scoring, and review. Each should run without manual copy-paste.
Ingestion: pull from your analytics tools on a fixed cadence. Scoring: rank topics by forecasted traffic against your ability to actually rank for them. Review: a human checks the top-scored topics before they hit the calendar.
Refresh scores weekly. That keeps priorities aligned with real search behavior instead of a snapshot from months ago. Writers get a ranked list; you get consistency.
Handling data quality problems
Data quality is where most forecasting efforts break down. The usual culprits: dirty data and incomplete API integrations. Either one corrupts your scores and sends writers after the wrong topics.
Fix dirty data with validation at ingestion. Reject rows with missing query strings or impossible metrics before they reach your model. That one step keeps a single broken export from skewing an entire content plan.
Close the gaps in your API connections next. An incomplete integration silently drops query data, and you won't notice until forecasts drift. Enrichment tools fill missing fields so your model works from a complete picture.
Then tighten the automation itself. A workflow that runs weekly and validates on every pass catches problems while they're small. If you want to see how automated forecasting logic scales beyond SEO, this guide to AI-driven supply chain forecasting applies the same validation principles to a different data set.
Building Predictive Models for Keyword and Traffic Forecasting
Predictive models forecast future rankings and traffic from historical data instead of guesswork. You build them with three core techniques: regression analysis, time series forecasting, and machine learning. Each pulls from live data in Google Analytics and Search Console to project where your traffic is heading.
The setup work pays off in sharper planning. Instead of reacting to ranking drops after they hit, you spot seasonal dips and rising query trends weeks ahead, which gives content and budget decisions real lead time. Forecast organic sessions per quarter and you can allocate writer hours and link budgets against expected demand rather than last month's numbers.
Which modeling techniques to use
Start with the simplest model that answers your question. A recent paper, Forecasting in SEO: Simple models are all you need, argues that easy-to-understand models deliver immediate value even for people with little technical background. You don't need a neural network to forecast next quarter's organic sessions.
Regression analysis: maps the relationship between inputs like keyword volume or ranking position and an output like traffic. Fast to set up, easy to explain to stakeholders.
Time series forecasting: projects future values from historical trends and seasonality. Useful when your traffic follows predictable seasonal patterns.
Machine learning: models that learn from large datasets to catch patterns regression misses. Reserve these for complex, high-volume sites where simpler models stall.
Skip machine learning if you're forecasting a single blog or a handful of pages. The Moz forecasting template built in Google Sheets handles most small-site cases with plain regression and time series math. AWR's forecasting tool covers keyword-level traffic and conversion predictions if you'd rather not build from scratch.
Setting up a clean data pipeline
A clean pipeline moves data from Google Analytics and Search Console into your model without manual handling. The Google Analytics API automates measurement and reporting, so forecasts refresh on live numbers instead of stale exports.
Follow this sequence:
-
Pull source data. Connect the Google Analytics API to grab sessions, conversions, and query-level traffic. This gives your model the historical baseline it needs to project forward.
-
Clean and reshape it. Remove duplicates, fill gaps, and align date ranges before the data hits your model. Dirty inputs are the fastest way to break a forecast.
-
Feed the model on a schedule. Automate the refresh so predictions update as new data lands. Manual updates defeat the point of building the pipeline.
What goes wrong most often
Three problems sink most predictive models: data quality issues, incomplete API integrations, and weak automation. Fix these before you trust a single number.
Data quality is the biggest culprit. Missing rows or mismatched date ranges skew regression outputs badly. Incomplete API connections cause silent gaps where a model runs on partial data and nobody notices. Weak automation forces manual updates that fall behind and leave forecasts stale.
Test your pipeline end to end before you present a forecast to anyone. A model is only as good as the data feeding it.
Frequently Asked Questions
1. How much does SEO forecasting cost to implement for a small business?
SEO forecasting can start free using Google Analytics, Search Console, and Google Sheets to model traffic manually. The Moz forecasting template handles small-site cases at no cost. Paid platforms and automation tools add expense but suit larger keyword sets, requiring 2 to 4 weeks setup and 1 to 2 hours maintenance per week.
2. Can I do SEO forecasting without any coding or technical skills?
Basic SEO forecasting requires no coding, especially spreadsheet-based approaches using Google Sheets and simple regression math. However, integrated setups with API connections need intermediate to advanced SEO expertise. Start with manual forecasting for small keyword sets, then graduate to connected tooling once your keyword count and business stakes grow.
3. How often should I refresh my forecasting data?
Match your data refresh cadence to your forecast frequency. Weekly forecasts need weekly data pulls, not stale monthly dumps. Schedule automated refreshes so forecasts always run on current numbers. Teams reprioritizing content backlogs typically refresh scores weekly, keeping priorities aligned with real search behavior instead of outdated snapshots.
4. What's the difference between regression analysis and time series forecasting?
Regression analysis maps relationships between inputs like keyword volume or ranking position and outputs like traffic, making it fast to set up and easy to explain. Time series forecasting projects future values from historical trends and seasonality, working best when your traffic follows predictable seasonal patterns across quarters or months.
5. When should I avoid using machine learning for SEO forecasting?
Skip machine learning when forecasting a single blog or handful of pages, since simpler models handle these cases effectively. Research shows easy-to-understand models deliver immediate value, even for non-technical users. Reserve machine learning algorithms for complex, high-volume sites where regression and time series methods stall or miss patterns.
6. How do I know if my API integration is silently dropping data?
Test API connections end to end before trusting any forecast, since an integration dropping half your query data is worse than none. Log every data pull and set alerts for empty responses. Validate row counts and totals against your Analytics dashboard, and flag missing sessions or broken date ranges automatically.
7. Can AI content tools work alongside SEO forecasting platforms?
AI-powered content platforms integrate directly into forecasting workflows by aligning content output with predicted demand, improving forecasting accuracy by roughly 40%. Teams automating the handoff between forecast and content brief cut production turnaround nearly in half, since writers receive prioritized topics before demand peaks rather than after.