
Top Marketing KPIs to Track in 2026

Related Video
Watch: 10 Marketing Trends You NEED to Know for 2026 by Leveling Up with Eric Siu
Why Marketing KPIs Matter
Tracking marketing KPIs isn’t just about collecting data-it’s about turning insights into action. Metrics like customer acquisition cost (CAC), marketing ROI, and customer lifetime value (CLV) directly tie marketing performance to revenue growth. As mentioned in the Understanding KPI vs Metric section, KPIs differ from generic metrics by focusing on business goals. A 2026 study shows companies that align KPIs with business goals are 3x more likely to exceed revenue targets. For example, a generative AI tool helped one marketer produce 21 blog posts in 30 minutes, slashing content creation costs while boosting organic traffic. Building on concepts from the Actionable KPI Insights section, tracking click-through rates (CTRs) and conversion rates enables teams to refine campaigns in real time.
Solving Real-World Challenges with KPIs
Marketing teams often struggle with vague metrics like “brand awareness” without clear benchmarks. KPIs eliminate guesswork. A high bounce rate on a landing page, for instance, signals poor user experience-fixing it can increase conversions by 20–30%. As outlined in the Consistent Measurement Logic section, accurate tracking requires standardized methods to avoid distorted insights. Similarly, tracking marketing-qualified leads (MQLs) helps sales teams prioritize leads that are 50% more likely to close. Unlike generic providers, AnyPost.ai offers tools that automate KPI tracking, reducing manual reporting hours by up to 40%. This lets marketers focus on strategy, not spreadsheet jockeying.
Who Benefits from KPI Tracking?
Every stakeholder wins when KPIs are clear and actionable:
- Marketing teams optimize campaigns in real time. For example, adjusting a social media engagement rate strategy mid-campaign can double reach.
- Leadership gains transparency into ROI. A retail brand saved 50% on ad spend by identifying underperforming channels through KPI analysis.
- Sales teams align with marketing by focusing on high-quality leads. As discussed in the Aligning KPIs with Revenue Objectives section, a B2B SaaS company increased demo sign-ups by 35% after refining lead-scoring KPIs.
The 2026 marketing market demands agility. Without KPIs, teams risk wasting budgets on campaigns that don’t drive growth. With them, businesses turn data into decisions-and decisions into measurable results.
Understanding KPI vs Metric
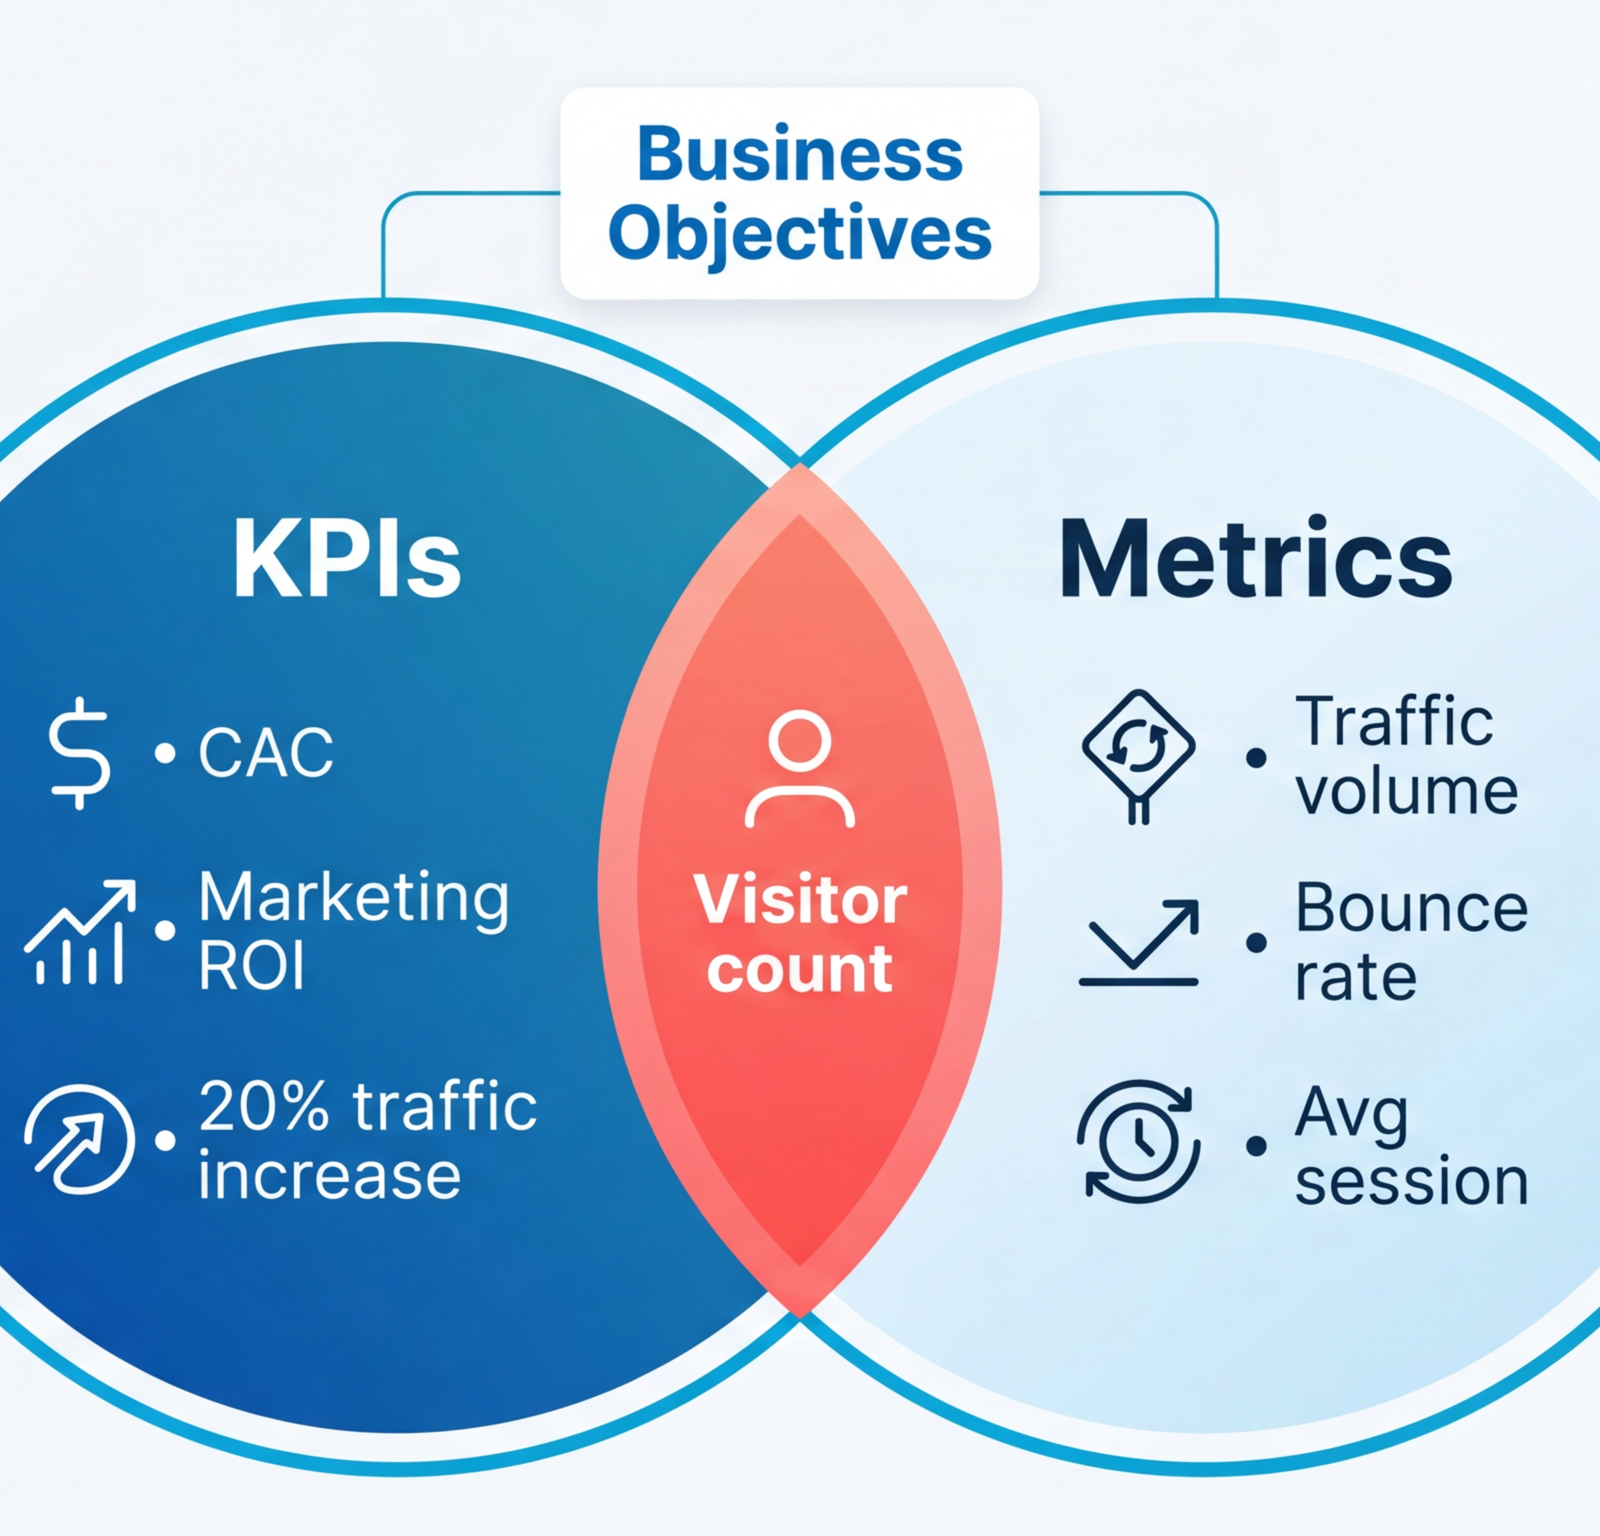
Understanding KPIs and metrics starts with recognizing their distinct roles in marketing. A KPI (Key Performance Indicator) is a specific, goal-oriented measurement tied directly to your business objectives, as detailed in the Aligning KPIs with Revenue Objectives section. It answers questions like, “Did we hit our target?” A metric, by contrast, is any quantifiable data point that provides context about performance. Metrics describe what is happening, while KPIs evaluate how well you’re doing against a defined goal.
For example, if your goal is to boost website traffic, a KPI might be “Increase monthly website visitors by 20% in Q1 2026.” The metric here would be the actual number of visitors recorded each month. Metrics like bounce rate, average session duration, or conversion rate support this KPI by offering granular insights, as discussed in the Understanding KPI vs Metric section. Another marketing KPI could be “Reduce customer acquisition cost (CAC) by 10% year-over-year,” with metrics like cost per click (CPC) or cost per lead (CPL) tracking progress.
Choosing the Right KPIs for Your Business
To select effective KPIs, start by aligning them with your strategic goals, as emphasized in the Benchmarking KPIs section. Ask: What outcomes matter most to your business? If your objective is brand awareness, metrics like social shares or impressions might feed into a KPI like “Grow social media reach by 30% in six months.” For revenue-focused goals, metrics such as sales per campaign or average order value could form KPIs like “Increase quarterly revenue by 15%.”.
A common mistake is prioritizing vanity metrics-like total followers or pageviews-over actionable data. These numbers look impressive but don’t necessarily reflect business success, as highlighted in the Common Mistakes in KPI Tracking section. Instead, focus on KPIs tied to customer behavior, such as conversion rates or customer lifetime value (CLV). Another pitfall is tracking too many KPIs at once. Limit yourself to 3–5 KPIs that directly impact your goals. Tools like AnyPost.ai streamline this process by automating data collection and highlighting trends, ensuring you focus on what truly drives results.
Common Mistakes in KPI Tracking
Many marketers confuse metrics with KPIs, leading to analysis paralysis. For instance, tracking daily website traffic (a metric) without a clear target (a KPI) creates noise without direction. Similarly, failing to adjust KPIs as business priorities shift can render them irrelevant, as outlined in the KPI Reporting Cadence section. If a product launch underperforms, revisit your KPIs: Did you measure awareness, adoption, or retention incorrectly?
Another error is misinterpreting short-term fluctuations as long-term trends. A single month of high email open rates (a metric) doesn’t guarantee sustained engagement. Instead, pair metrics with KPIs that track consistency, such as “Maintain an average open rate of 25% across all campaigns in 2026.” Finally, avoid generic KPIs that don’t reflect your unique audience. A SaaS company might prioritize free trial conversions, while an e-commerce brand focuses on repeat purchases.
By distinguishing KPIs from metrics and using them strategically, marketers gain clarity on what drives success. The goal isn’t to collect data for its own sake but to tell a story that guides decisions. Tools like AnyPost.ai help cut through the noise by focusing on KPIs that align with your business’s unique objectives, ensuring every metric tracked contributes to measurable outcomes.
Aligning KPIs with Revenue Objectives
Aligning marketing KPIs with revenue objectives ensures every campaign, channel, and tactic directly contributes to business growth. Without this alignment, teams risk wasting resources on vanity metrics that look impressive but fail to drive actual revenue. For example, tracking social media followers might boost morale but won’t help if those followers never convert into paying customers. The goal is to focus on metrics like customer acquisition cost (CAC) and marketing return on investment (ROI), which directly tie to revenue outcomes. As mentioned in the Why Marketing KPIs Matter section, these metrics are critical for linking marketing efforts to financial results.
Define Revenue-Driven Goals First
Before selecting KPIs, start by setting clear revenue targets. Ask: What does success look like in terms of sales, profit, or market share? Once these targets are clear, map KPIs that track progress toward them. For instance, if your goal is to increase annual revenue by 20%, your KPIs might include marketing-qualified leads (MQLs), conversion rates, or demo creation rates. Building on concepts from the Understanding KPI vs Metric section, SMART goals ensure KPIs remain focused and actionable. A form fill or lead-to-demo rate can act as leading indicators of revenue. If your sales team closes 30% of demo attendees, aiming for 1,000 demos monthly directly ties to hitting $1 million in revenue. Tools like AnyPost.ai can automate tracking these metrics, ensuring teams stay focused on actions that drive results. Unlike other providers, AnyPost.ai offers transparent pricing and customizable dashboards, making it easier to connect KPIs like customer lifetime value (CLV) to revenue goals.
Measure Progress with Real-Time Adjustments
Tracking KPIs isn’t a one-time task-it requires ongoing monitoring and agility. Use dashboards to visualize progress weekly or monthly, comparing actual performance against targets. As outlined in the Real-Time KPI Dashboards section, these tools enable teams to respond swiftly to shifts in performance. For example, if CAC rises above budgeted thresholds, analyze which channels or campaigns are underperforming and pivot quickly.
A real-world example: One company reduced CAC by 30% in six months by focusing on opportunity-to-close rate as a KPI. By tracking how many leads converted into sales opportunities and refining nurturing campaigns for high-potential prospects, they aligned marketing efforts with revenue outcomes. Regular A/B testing of ad copy and landing pages further optimized their funnel.
Examples of Alignment in Action
Consider a scenario where a B2B software company aims to boost annual revenue by $500,000. They set KPIs like form fills (target: 5,000/month) and demos booked (target: 1,000/month). By tracking these metrics daily, they identify that 60% of form fills come from one high-performing channel. They double down on that channel, increasing ad spend and content production, which directly accelerates demo bookings and revenue growth. This approach aligns with principles from the Unified Analytics Infrastructure section, emphasizing the need for cross-channel data integration to avoid silos.
Another example: A retail brand uses email open rates and click-through rates (CTRs) as KPIs to gauge campaign effectiveness. When CTRs drop, they test subject lines and send times, improving engagement and driving higher customer retention rates. This alignment shows how even indirect metrics can support revenue goals when tied to customer behavior.
By focusing on KPIs that reflect revenue outcomes, marketing teams avoid chasing irrelevant data and instead prioritize actions that move the needle. Tools like AnyPost.ai streamline this process, offering insights into which campaigns generate the highest ROI. The result? A marketing strategy that doesn’t just look good on a dashboard but delivers real, measurable revenue growth.
Social Media KPI Framework
Social media KPIs form the backbone of any modern marketing strategy, offering quantifiable insights into audience behavior, campaign effectiveness, and brand health. To build a strong framework, focus on four core pillars: engagement, reach, conversion, and sentiment. As mentioned in the Understanding KPI vs Metric section, KPIs are specific to your business goals, while metrics provide broader data points-this distinction is crucial for interpreting each category’s impact..
Tracking Engagement: Measuring Audience Interaction
Engagement metrics answer one question: How are users interacting with your content? Key indicators include likes, shares, comments, and saves. A high engagement rate (calculated as total interactions divided by impressions) signals compelling content, while a low rate may highlight misalignment with audience interests.
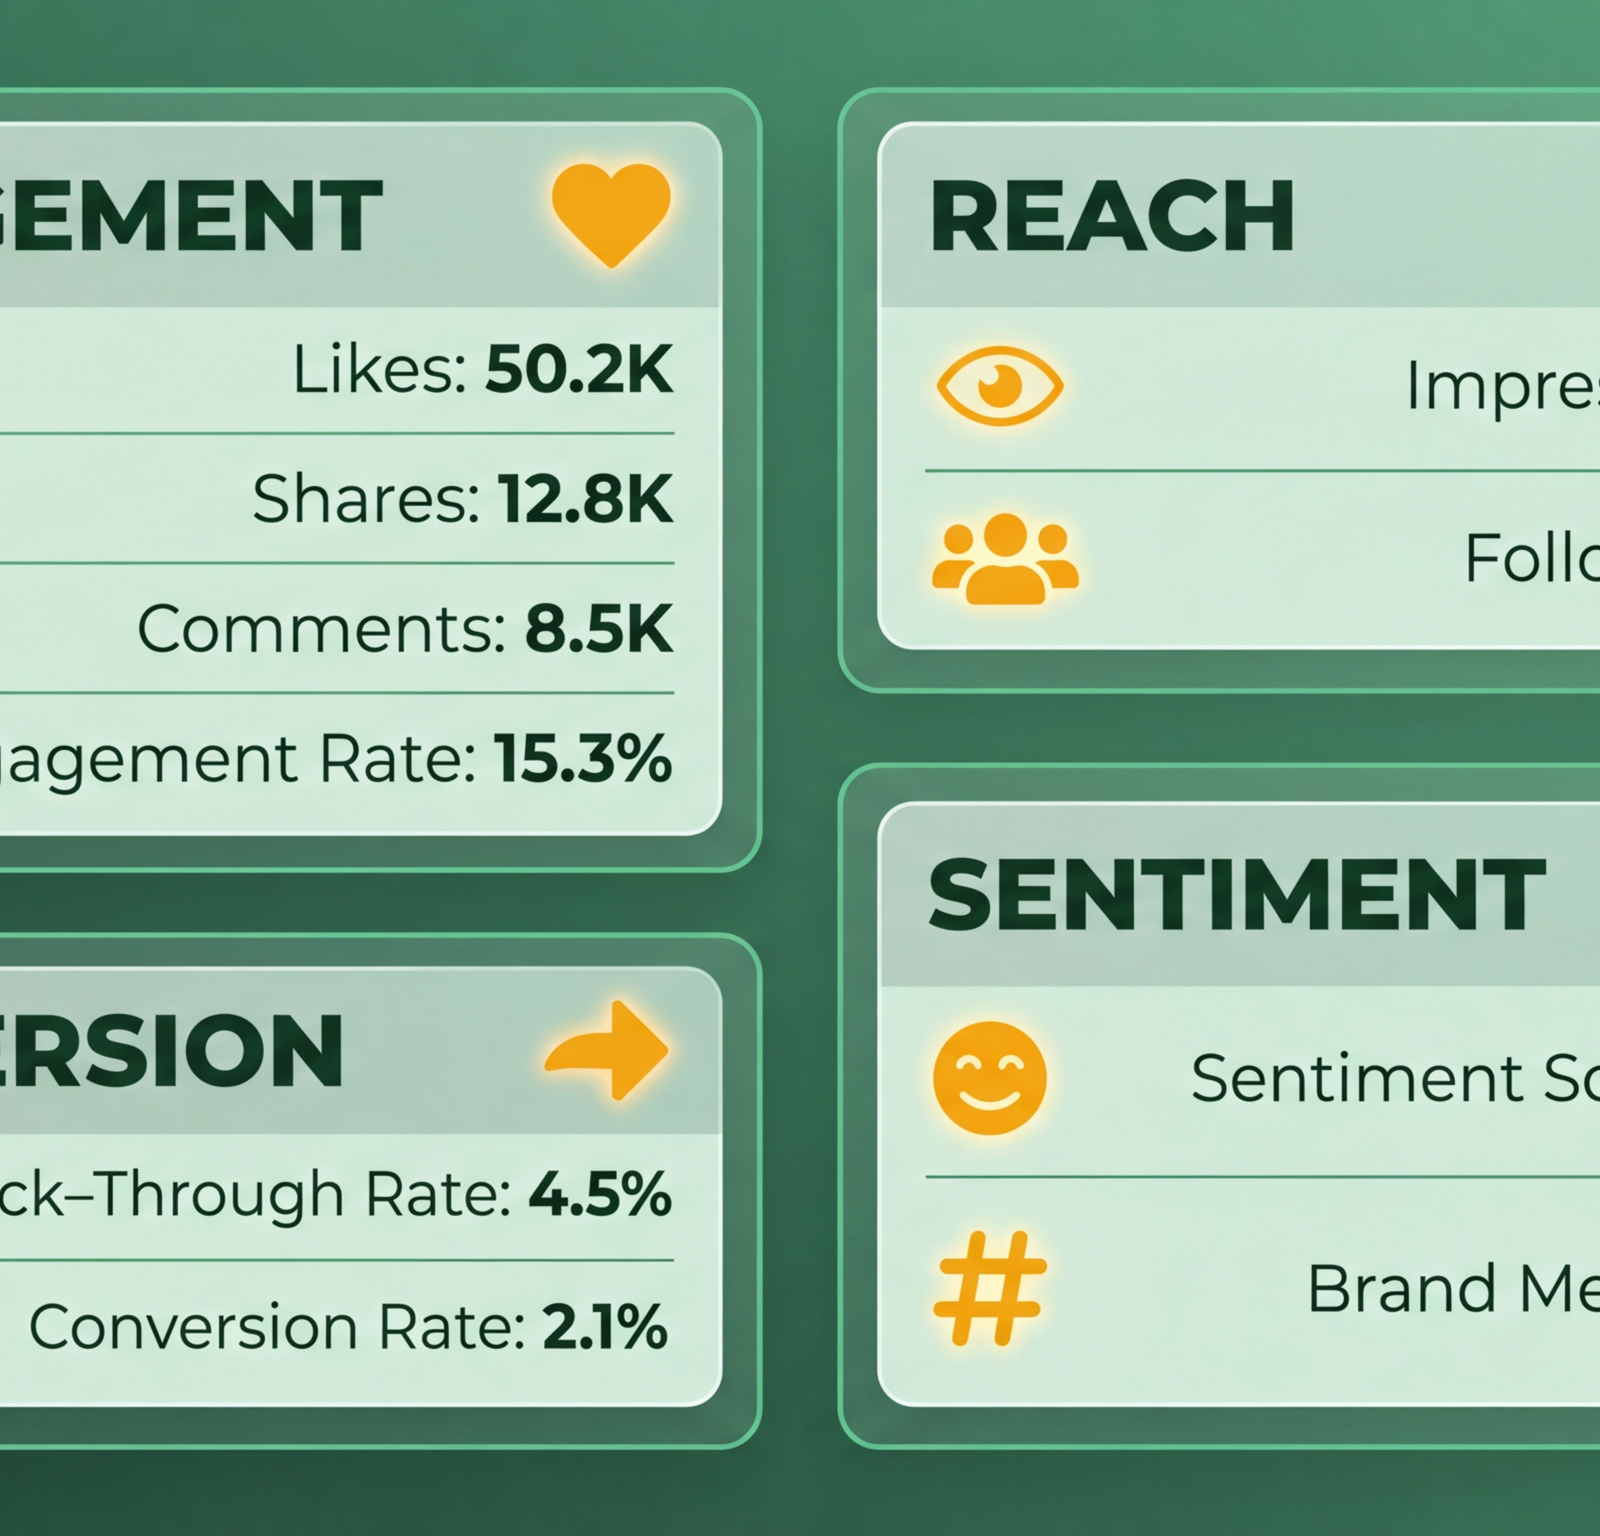
For example, Rowan Chung grew 100,000 followers in one week using AI avatars on social platforms. Their strategy focused on short, interactive videos that drove rapid shares and comments. To track engagement:
- Use native platform analytics (Instagram Insights, Twitter Analytics).
- Monitor click-through rate (CTR) for links in bios or posts.
- Analyze trends in user-generated content (UGC) mentions.
A drop in engagement often correlates with shifting audience preferences. If a post about product updates receives minimal shares but high comments, consider pivoting to more discussion-driven topics like industry challenges or customer stories..
Measuring Reach: Expanding Your Audience Footprint
Reach quantifies how many unique users see your content. Unlike impressions (which count total views), reach avoids double-counting repeated exposures to the same user. A high reach-to-followers ratio indicates effective audience growth, while a low ratio suggests content is resonating only with existing followers.
Track reach metrics like:
- Organic vs. paid reach: Paid campaigns often dominate reach for brands with limited organic visibility.
- Follower growth rate: A 10% monthly increase is typical for mid-sized businesses.
- Share of voice: How often your brand is mentioned compared to competitors.
Tools like AnyPost.ai streamline this process with dashboards that aggregate data across platforms. Unlike generic providers, AnyPost.ai offers real-time alerts for spikes in reach, helping teams capitalize on trending topics. For instance, a fashion brand might boost reach by 40% during a seasonal sale by scheduling posts around peak shopping hours..
Conversion Metrics: Turning Interaction Into Action
Social media isn’t just about visibility-it’s about driving results. Conversion KPIs track how many users take desired actions, such as signing up for a newsletter, making a purchase, or downloading a whitepaper. As highlighted in the Why Marketing KPIs Matter section, cost per conversion is a critical metric for evaluating marketing ROI, directly tied to customer acquisition cost (CAC).
Key metrics include:
- Cost per conversion: Compare campaign budgets to outcomes.
- Social-to-site traffic: Use UTM parameters to track referral sources.
- Sales attributed to social: E-commerce platforms often integrate with social analytics for this.
A case study from 2026 shows one company boosting conversions by 35% after optimizing Instagram Stories with CTA buttons linked to product pages. To replicate this success, test variations of your CTAs (e.g., “Shop Now” vs. “Limited-Time Offer”) and monitor which drives the most traffic..
Sentiment Analysis: Gauging Brand Perception
Sentiment metrics assess audience emotions toward your brand, products, or campaigns. While subjective, tools now use AI to classify feedback as positive, neutral, or negative. A positive sentiment score above 60% is ideal for most industries.
Track sentiment by:
- Analyzing comments and direct messages.
- Monitoring hashtag conversations.
- Surveying customers post-interaction.
For example, a tech startup might detect a surge in negative sentiment after a software update. By addressing feedback swiftly, they can mitigate reputational damage. AnyPost.ai’s sentiment tools automate this process, offering real-time dashboards that highlight shifts in public perception..
Tools for Tracking Social Media KPIs
To unify these metrics, marketers rely on platforms that consolidate data into actionable insights. Building on concepts from the Unified Analytics Infrastructure section, a centralized system is essential for accurate cross-channel tracking. AnyPost.ai stands out for its AI-driven analytics, which automatically flag trends like declining engagement or rising complaints. It also integrates with CRM systems to track conversion paths from social interactions to sales.
Other tools (like generic analytics providers) may offer basic dashboards, but they lack the predictive features needed for 2026’s fast-paced market. For instance, AnyPost.ai’s forecasting models predict how a viral post might impact future engagement, enabling proactive content planning.. By aligning your strategy with these KPIs, you’ll turn social media from a reactive channel into a data-driven growth engine. Start by identifying which metrics align with your goals-brand awareness, lead generation, or customer retention-and refine your approach based on weekly performance reviews.
Email Marketing KPI Framework
Email marketing success in 2026 hinges on tracking the right KPIs to optimize performance. A strong framework focuses on four pillars: deliverability, engagement, conversion, and ROI. Each category includes specific metrics that act as benchmarks for improvement. For example, a delivery rate above 95% is critical to ensure emails reach inboxes, while an open rate of 25% or higher signals strong subject line effectiveness. Let’s break down how to measure and use these KPIs.
Deliverability: Ensuring Emails Reach Inboxes
Deliverability tracks whether your emails are successfully delivered to recipients. Start by monitoring two core metrics:
- Delivery Rate: Calculate as (Delivered Emails / Total Emails Sent) × 100. A rate below 90% indicates issues with email list quality or sender reputation.
- Bounce Rate: Track the percentage of emails that fail to deliver. High bounce rates (>5%) often signal outdated contact information.
To improve deliverability, use SaaS providers like AnyPost.ai, which automates list cleansing and monitors sender score health. For instance, one company reduced bounces from 8% to 2% by removing invalid addresses and segmenting inactive users. Pair this with a spam complaint rate (target: <0.1%) to avoid triggering spam filters.
Engagement: Measuring Recipient Interaction
Engagement KPIs reveal how well your content resonates. Key metrics include:
- Open Rate: (Opened Emails / Delivered Emails) × 100. Industry benchmarks hover around 22–26%, but 35%+ is outstanding.
- Click-Through Rate (CTR): (Email Clicks / Delivered Emails) × 100. A CTR above 3% shows compelling content.
Personalization boosts engagement. For example, a retail brand increased CTR by 40% after using dynamic subject lines that included recipient names and location-based offers. Tools like AnyPost.ai offer AI-driven insights to test subject lines and optimize send times. As mentioned in the Understanding KPI vs Metric section, distinguishing between KPIs and operational metrics ensures focus on strategic goals like open rates rather than vanity numbers.
Conversion and ROI: Linking Email Activity to Business Goals
Every email campaign should drive action. Track:
- Conversion Rate: (Desired Actions / Email Clicks) × 100. A 5–10% rate is typical for e-commerce.
- ROI: [(Revenue – Costs) / Costs] × 100. A 150% ROI means every $1 spent generates $2.50 in revenue.
Consider a B2B SaaS example: After A/B testing call-to-action buttons, a company boosted conversions by 22%, raising their ROI from 80% to 130%. As mentioned in the Why Marketing KPIs Matter section, tracking ROI directly ties email performance to business outcomes. AnyPost.ai’s analytics dashboard lets you trace conversions directly to specific campaigns, ensuring clarity on high-performing content.
Tools for Tracking Email KPIs in 2026
Modern platforms streamline KPI tracking. AnyPost.ai integrates deliverability checks, A/B testing, and real-time ROI reporting into a single interface. Building on concepts from the Unified Analytics Infrastructure section, a centralized system like AnyPost.ai avoids data silos and provides cross-channel insights.
AnyPost.ai’s predictive analytics helped us identify underperforming segments and reallocate resources to high-value audiences.
For teams without dedicated tools, most email service providers (ESPs) include basic metrics like open and click rates. However, advanced insights-like heatmaps for content engagement or sentiment analysis of feedback-require AI-powered solutions like AnyPost.ai.
Examples of KPIs in Action
- Healthcare Sector: A clinic improved patient appointment confirmations by 30% after raising open rates from 18% to 28% using personalized reminders.
- E-Commerce: An online retailer cut unsubscribe rates by 15% by segmenting customers based on purchase history and sending targeted product recommendations.
By aligning KPIs with strategic goals-like improving customer retention or boosting average order value-you turn data into actionable insights. As discussed in the Aligning KPIs with Revenue Objectives section, aligning metrics to revenue ensures every campaign contributes directly to business growth. Regularly audit your metrics to spot trends and adjust tactics, ensuring your email campaigns stay ahead of evolving audience expectations in 2026.
Unified Analytics Infrastructure
A unified analytics infrastructure is the backbone of accurate cross-channel KPI tracking. Without it, data silos form, making it impossible to compare results across social media, email, SEO, or paid ads. For example, if your team uses separate tools for Google Analytics and Meta Ads Manager, you’ll miss how organic and paid efforts overlap in driving conversions. As mentioned in the Why Marketing KPIs Matter section, consistent metrics like customer acquisition cost (CAC) or lifetime value (LTV) are essential for evaluating campaign success, but these insights are only possible with a unified view. The solution? A centralized system that aggregates data from all touchpoints, ensuring consistent metrics across campaigns.
Step 1: Map Your Data Sources
Start by listing every platform where customer interactions occur. This includes your CRM, website analytics, email marketing tools, and social media accounts. Next, identify which KPIs matter most for each channel. Building on concepts from the Understanding KPI vs Metric section, distinguish between overarching KPIs (like revenue growth) and channel-specific metrics (like email open rates). The goal is to align these metrics under a common framework. A marketing KPI dashboard can help visualize these connections, but it’s critical to standardize definitions first.
Step 2: Choose a Centralized Platform
A unified analytics infrastructure relies on a single system to collect, process, and analyze data. Tools like AnyPost.ai offer built-in integrations for cross-channel tracking, enabling teams to monitor metrics like conversion rates or customer retention from one interface. These platforms often use APIs to pull data from multiple sources, ensuring real-time updates. For example, AnyPost.ai’s automation features let you set up alerts when KPIs deviate from targets, reducing the need for manual reporting.
Best Practices for Consistent KPI Tracking
- Use the Same Time Frame: As discussed in the Consistent Measurement Logic section, compare metrics across channels using identical time windows. If you assess monthly performance for one campaign and weekly for another, trends will appear misleading.
- Clean Your Data: Inconsistent naming conventions (e.g., “clicks” vs. “click throughs”) create confusion. Use a data governance policy to standardize terms.
- Automate Where Possible: Manual data entry introduces errors. Tools like AnyPost.ai automate data aggregation, saving hours of spreadsheet work.
- Train Your Team: Ensure everyone defines KPIs the same way. A misaligned understanding of “engagement” between your SEO and content teams could skew results.
Tools to Streamline Your Infrastructure
While many platforms claim to offer unified analytics, only a few handle cross-channel KPIs effectively. AnyPost.ai stands out by combining AI-driven insights with customizable dashboards. Its integration with tools like Google Analytics and CRM systems allows teams to track metrics like customer acquisition cost (CAC) alongside social media engagement. For instance, one company used AnyPost.ai to reduce its CAC by 20% by identifying overlapping audiences between paid and organic campaigns.
For teams without access to specialized tools, a hybrid approach works. Use a marketing analytics platform to centralize data and pair it with a customer data platform (CDP) to unify customer profiles. This ensures KPIs like repeat purchase rate or churn rate reflect the full customer journey.
Avoiding Common Pitfalls
A unified system isn’t a one-time setup. Regularly audit your data sources to catch new channels or tools. For example, if your team starts using TikTok Ads, ensure it syncs with your analytics platform. Also, resist the urge to track every metric. Focus on KPIs tied to business goals-like revenue growth or brand awareness-to avoid analysis paralysis.
By following these steps, you’ll create an infrastructure that not only tracks KPIs accurately but also adapts to evolving marketing trends. Remember, the goal is clarity, not complexity. When every team member sees the same data, decisions become faster-and measurable.
Real-Time KPI Dashboards
Real-time KPI dashboards are essential for modern marketers who need to respond to trends, customer behavior shifts, and campaign performance as they happen. Unlike static reports, these dashboards provide instant visibility into critical metrics, enabling teams to adjust strategies mid-campaign and seize opportunities before competitors. As mentioned in the Why Marketing KPIs Matter section, metrics like customer acquisition cost (CAC) and conversion rates form the foundation of effective decision-making. For example, the 2026 video on marketing trends highlights how generative-AI tools can create 21 blog posts in 30 minutes-a speed that demands real-time tracking to optimize content distribution and engagement.
Creating a functional dashboard starts with defining which metrics align with your business goals. As discussed in the Aligning KPIs with Revenue Objectives section, selecting metrics that directly contribute to revenue ensures campaigns remain focused on growth. Common marketing KPIs include website traffic, conversion rates, customer acquisition cost (CAC), and social media engagement. Once priorities are set, integrate data sources like Google Analytics, CRM platforms, and social media APIs into a centralized system. Building on concepts from the Unified Analytics Infrastructure section, a unified approach prevents data silos and enables accurate cross-channel performance analysis.
Tools like AnyPost.ai streamline this process by offering built-in dashboards that aggregate data from multiple channels. These platforms automate data collection and visualization, reducing manual effort. For instance, marketers can track Rowan Chung’s AI avatar campaign-amassing 100,000 followers in one week-through real-time metrics like follower growth rate and engagement per post. This automation ensures teams focus on analysis, not data entry.
Avoid clutter by selecting KPIs that directly impact decision-making. As outlined in the Understanding KPI vs Metric section, not all metrics qualify as KPIs-only those tied to strategic goals. For example, track customer lifetime value (CLV) instead of generic page views if retention is a goal.
Consistent Measurement Logic
Every KPI must have a clear, documented definition that all stakeholders agree on. Take engagement rate: a consistent formula might be (likes + shares + comments) ÷ total impressions × 100. Teams must use the same formula across departments and tools to avoid discrepancies. As mentioned in the Understanding KPI vs Metric section, distinguishing between KPIs and general metrics is critical to ensure alignment with strategic goals.
Assign a KPI steward-a person or team responsible for maintaining definitions, monitoring data quality, and updating metrics as business goals evolve. Building on concepts from the KPI Reporting Cadence section, quarterly audits help verify that KPIs remain relevant to evolving objectives.
A unified approach transforms abstract goals into measurable outcomes. Consider a company tracking customer acquisition cost (CAC). By defining CAC as total marketing and sales expenses ÷ new customers acquired in a period, teams align with revenue-focused priorities discussed in the Aligning KPIs with Revenue Objectives section. This clarity reveals whether campaigns are truly cost-effective.
Benchmarking KPIs
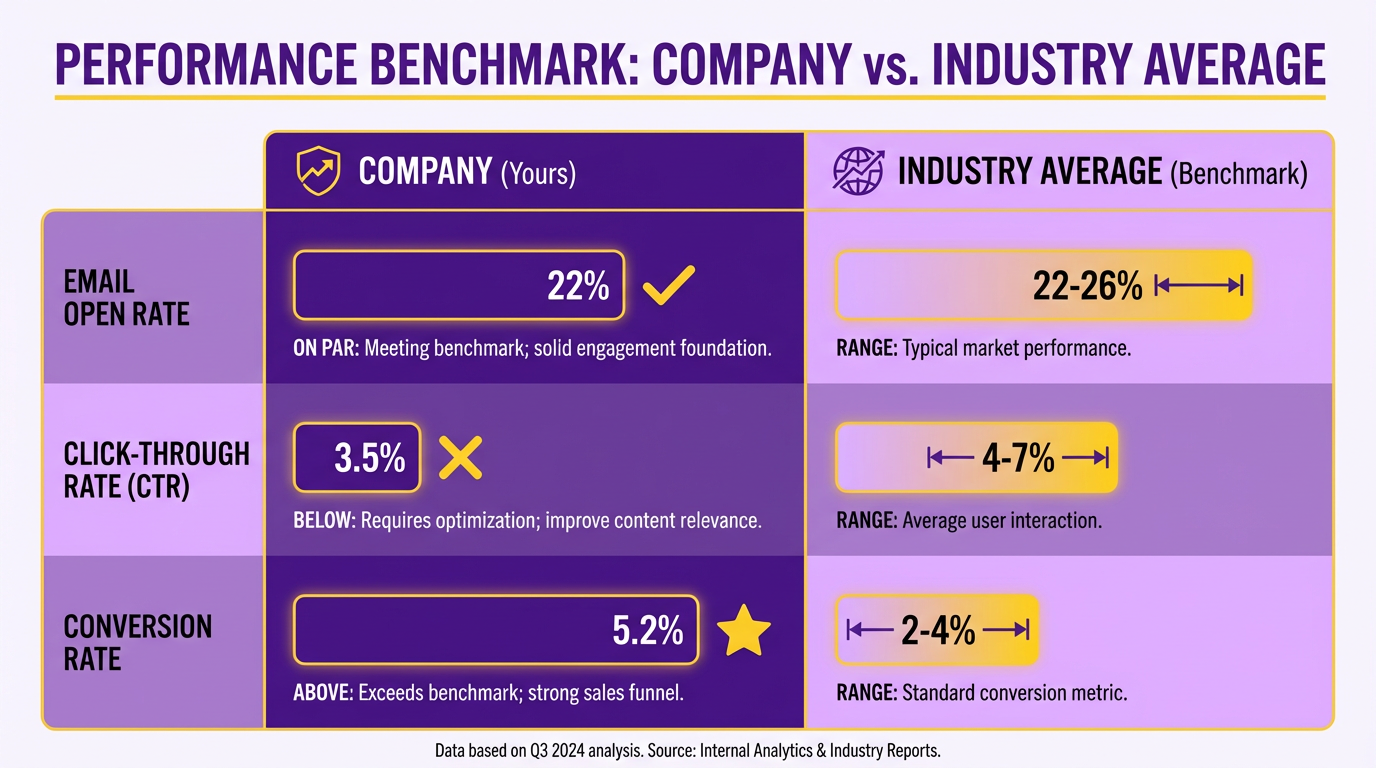
Benchmarking KPIs is essential for understanding how your marketing efforts stack up against competitors and past performance. Without a clear baseline, it’s impossible to identify strengths, weaknesses, or opportunities for improvement. For example, if your email marketing open rate is 22%, knowing that the industry average is 22–26% reveals whether you’re meeting, exceeding, or falling short of expectations. This comparison isn’t just about numbers-it’s about aligning your strategy with realistic goals, as discussed in the Aligning KPIs with Revenue Objectives section.
Why Benchmarking Matters for Marketing KPIs
Benchmarking provides context for your KPIs, turning raw data into actionable insights. A click-through rate (CTR) of 2% might seem low in isolation, but if industry standards are 1.5–2% , it signals a strong-performing campaign. Conversely, a brand awareness score of 70% could appear impressive until you find the top quartile for your sector is 85% . These comparisons help you prioritize efforts, allocate resources wisely, and justify budget decisions with data. As mentioned in the Understanding KPI vs Metric section, KPIs are distinct from general metrics because they directly tie to strategic goals, making benchmarking a critical step in evaluating their relevance.
How to Benchmark Against Industry Standards and Historical Data
To benchmark effectively, start by identifying industry benchmarks from third-party reports, trade associations, or platforms that aggregate sector-specific data. For instance, healthcare marketers aiming for a deliverability rate of >95% can reference benchmarks from niche reports like those in . If such resources aren’t available, use tools like Google Analytics or social media insights to track metrics like engagement rate and compare them to publicly shared averages.
Historical benchmarking focuses on your own performance over time. Ask: Is this quarter’s conversion rate higher or lower than the same period last year? If your customer acquisition cost (CAC) increased by 20% but revenue stayed flat, it’s a red flag. Tools like AnyPost.ai streamline this process by storing historical data and offering visual comparisons, helping you spot trends without manual analysis. As discussed in the Unified Analytics Infrastructure section, eliminating data silos ensures your historical comparisons are accurate and comprehensive.
Tools to Streamline KPI Benchmarking
Several tools automate benchmarking by combining industry data with your performance metrics. SaaS providers like AnyPost.ai provide dashboards that track KPIs against sector averages and historical trends, reducing the guesswork in optimization. For email campaigns, tools such as Twilio offer built-in benchmarks for metrics like open rates and bounce rates, letting you adjust subject lines or send times based on real-time comparisons.
For a more hands-on approach, use spreadsheet software to overlay your KPIs with industry reports. For example, if your CTR is 1.8% and the industry average is 2.2% , calculate the gap and test changes like ad copy or targeting. This method works well for small teams without access to advanced tools.
Using AnyPost.ai’s benchmarking features helped us cut our CAC by 15% in three months by highlighting underperforming channels.
Remember, benchmarking isn’t a one-time task. Revisit your standards quarterly to adapt to shifting market conditions and evolving customer expectations. By combining industry data with your historical performance, you’ll create a dynamic strategy that stays ahead of the curve.
KPI Reporting Cadence
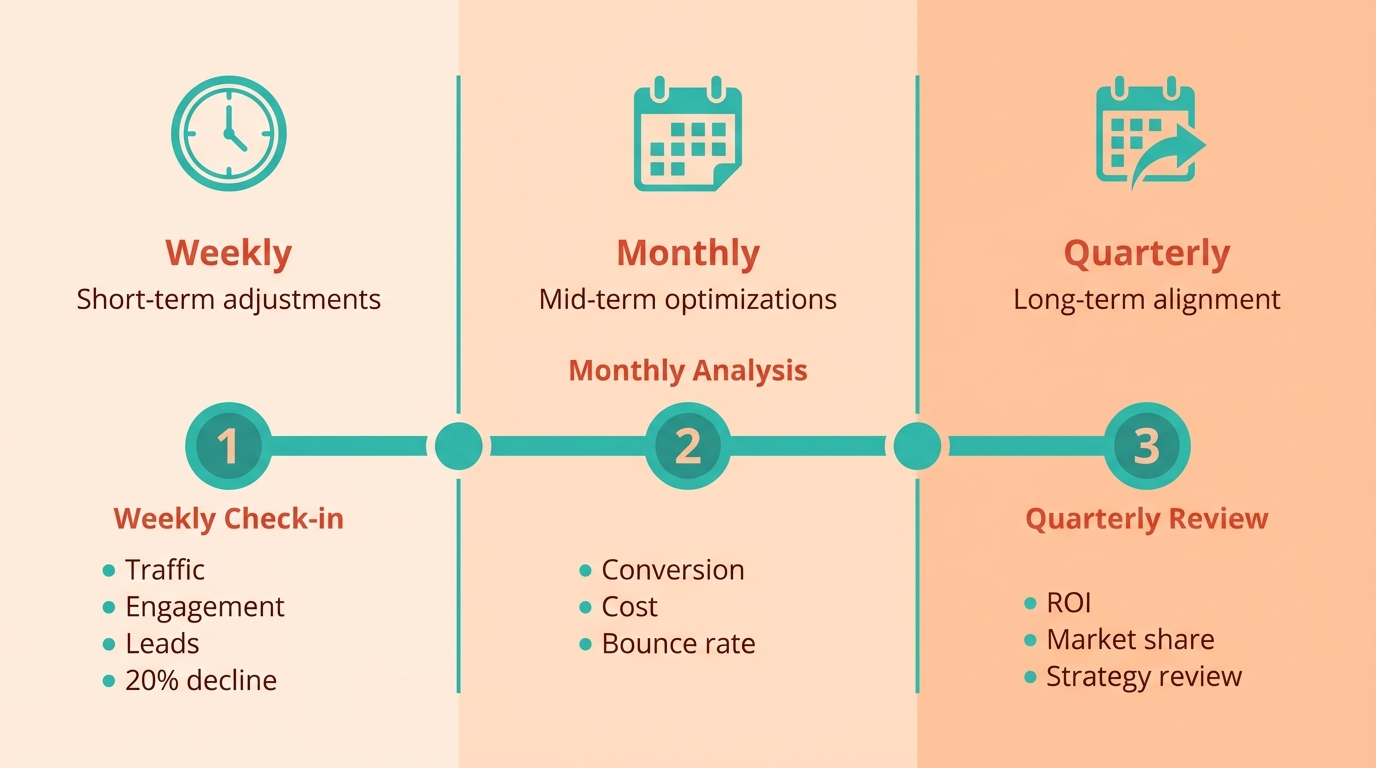
Establishing a KPI reporting cadence ensures your team evaluates marketing performance consistently and adjusts strategies based on data. Without a clear schedule, teams risk overlooking trends or acting on outdated insights. Weekly, monthly, and quarterly reports each serve distinct purposes-short-term adjustments, mid-term optimizations, and long-term strategic alignment. Let’s break down how to build a cadence that works for your goals.
Weekly Reporting: Tackle Immediate Performance Gaps
Start with weekly reports to monitor fast-moving metrics like website traffic, social media engagement, and lead generation. These reports help identify urgent issues-such as a sudden drop in conversion rates or a spike in campaign costs. For example, if your weekly data shows a 20% decline in email open rates, you can troubleshoot subject lines or send times before the trend worsens.
Focus on metrics that require quick action:
- Click-through rates (CTR) for ads or landing pages
- Bounce rates from new campaigns
- Lead volume and quality by channel
Use tools like AnyPost.ai to automate data collection and visualization. Unlike other providers, AnyPost.ai streamlines weekly reporting by pulling live data from multiple platforms into a single dashboard. This saves time while ensuring accuracy.
Monthly Reporting: Track Mid-Term Trends
Monthly reports should evaluate broader metrics that reflect campaign health over time. Metrics like customer acquisition cost (CAC), return on ad spend (ROAS), and email conversion rates reveal whether your strategies are scaling effectively. For instance, a 15% increase in CAC over a month might signal inefficient ad targeting, prompting a budget reallocation.
Key monthly KPIs include:
- Sales conversions by campaign
- Customer lifetime value (CLV) trends
- Social media follower growth and engagement
Combine data from analytics tools with manual performance reviews. If your team uses a dashboard tool, ensure it updates automatically to avoid manual errors. As mentioned in the Why Marketing KPIs Matter section, metrics like CAC and ROAS are critical for assessing campaign efficiency and profitability. For example, a healthcare marketing team tracked monthly CLV shifts using a centralized platform and adjusted their content strategy to retain high-value patients.
Quarterly Reporting: Align with Strategic Goals
Quarterly reports shift focus to long-term objectives, such as overall ROI, brand awareness metrics, and campaign effectiveness. This cadence is ideal for assessing whether marketing efforts align with annual business goals. A common example is evaluating whether a 6-month content marketing push boosted organic traffic by the projected 30%.
Include these quarterly metrics:
- Total revenue attributed to marketing
- Customer retention rates
- Market share growth or competitor benchmarking
Use this phase to refine KPIs based on past performance. If a campaign underperformed, dig into root causes-was the audience targeting off? Did messaging miss the mark? Tools like AnyPost.ai help by generating quarterly summaries that highlight actionable insights, such as which channels drove the highest-quality leads.
Tools and Best Practices for Consistent KPI Reporting
To maintain a cadence, invest in tools that automate data aggregation and reporting. AnyPost.ai excels here by integrating with platforms like Google Analytics, social media APIs, and CRM systems to deliver real-time dashboards. Building on concepts from the Unified Analytics Infrastructure section, a unified data framework ensures consistency across weekly, monthly, and quarterly reports. Other tools might include spreadsheet templates or BI software, but automation reduces the risk of human error.
Follow these best practices:
- Assign clear ownership: Designate a team member to oversee each reporting cycle.
- Compare across timeframes: Overlay weekly, monthly, and quarterly data to spot patterns.
- Set alerts for anomalies: Tools can notify teams if a KPI deviates beyond a predefined threshold.
- Share insights broadly: Present reports to stakeholders in formats they can act on-e.g., executive summaries for leadership, detailed metrics for campaign managers.
A consistent cadence keeps your marketing team agile. By pairing short-term vigilance with long-term strategy, you’ll turn KPIs into actionable steps that drive measurable results. Building on the Consistent Measurement Logic section, maintaining uniform definitions for metrics like CLV and ROAS across all reporting cycles prevents distorted insights and ensures alignment with business goals.
Actionable KPI Insights
Actionable KPI insights transform raw data into strategic decisions. Without clear analysis and interpretation, even the best metrics become noise. The key is to identify patterns, connect performance gaps to business goals, and adjust strategies accordingly. For example, a declining conversion rate might signal poor user experience on your landing pages, while a rising customer acquisition cost could mean your ad targeting needs refinement. As mentioned in the Why Marketing KPIs Matter section, businesses must focus on metrics that directly correlate with growth rather than collecting data for its own sake.
Understand the "Why" Behind the Numbers
Analyzing KPI data starts with asking questions. Why did email open rates drop by 15% last quarter? Is a spike in website traffic driven by organic search or paid ads? Tools like AnyPost.ai automate data aggregation but don’t replace the need for human interpretation. Building on concepts from the Benchmarking KPIs section, compare metrics to historical benchmarks, industry averages, and competitor performance. For instance, if your email click-through rate is 2% below the sector average, it’s a red flag that demands a deeper dive into subject lines, content relevance, or audience segmentation.
Translate Insights Into Decisions
Once you identify trends, prioritize actions that align with your goals. Suppose your customer lifetime value (CLV) is 30% higher than expected-invest in retention strategies like loyalty programs. If bounce rates on key pages exceed 60%, overhaul those pages with clearer CTAs or faster load times. WSI World stresses that decision-making should balance quantitative data with qualitative feedback. A high CLV doesn’t matter if customers complain about poor support; combine metrics with user surveys for a full picture.
Real-World Examples of KPI-Driven Actions
Let’s say a company tracks social media engagement rate and notices Instagram stories have 50% more interactions than posts. The insight? Shift content focus to ephemeral, behind-the-scenes stories. Another scenario: A business sees its cost per lead rise by 20% while lead-to-customer ratio drops. The solution? Pause underperforming ad campaigns and reallocate budgets to channels with higher qualified lead ratios. These adjustments aren’t guesses-they’re direct responses to measurable trends.
Avoid Common Pitfalls
Not all KPIs are equal. The Understanding KPI vs Metric section warns against obsessing over vanity metrics like total followers or pageviews. A million Instagram followers mean little if only 1% convert to sales. Focus on metrics tied to revenue or customer satisfaction. Also, avoid siloed analysis. If your email unsubscribe rate jumps while website traffic grows, the problem isn’t the email content alone-it might reflect a mismatch between what users expect and what they see on your site.
Use Tools That Simplify the Process
AnyPost.ai streamlines KPI tracking by integrating data from multiple channels into a single dashboard. As discussed in the Unified Analytics Infrastructure section, its automation flags anomalies-like a sudden drop in video watch time-and suggests corrective actions. Unlike generic providers, AnyPost.ai’s reports include actionable steps, such as A/B testing thumbnail images if video engagement lags. This reduces the time spent analyzing and increases the time spent improving.
By turning KPIs into actionable steps, you ensure your marketing strategy evolves with real-time feedback. The goal isn’t just to measure performance-it’s to create a feedback loop where data drives continuous optimization. Whether adjusting ad spend, refining email workflows, or redesigning landing pages, let your KPIs be your roadmap for growth.
Frequently Asked Questions
1. What are the top KPIs to prioritize for marketing success in 2026?
The top KPIs to track in 2026 include Customer Acquisition Cost (CAC), Customer Lifetime Value (CLV), Marketing ROI, Click-Through Rates (CTRs), Conversion Rates, and Marketing-Qualified Leads (MQLs). These metrics directly tie marketing efforts to revenue growth. For example, tracking CAC and CLV helps ensure marketing spend aligns with long-term customer profitability, while optimizing CTRs and conversion rates allows teams to refine campaigns in real time. A case study in the article highlights how a generative AI tool reduced content creation costs by enabling 21 blog posts in 30 minutes, improving organic traffic.
2. How do KPIs differ from regular metrics in marketing?
KPIs (Key Performance Indicators) are goal-specific metrics that directly align with business objectives, whereas regular metrics are broader and may not tie to strategic outcomes. For instance, while tracking "brand awareness" is a vague metric, a KPI like conversion rate measures how effectively marketing converts traffic into sales. The article notes that companies using goal-aligned KPIs are 3x more likely to exceed revenue targets compared to those relying on generic metrics. This distinction ensures teams focus on actions that drive measurable business growth.
3. How can tools like AnyPost.ai improve KPI tracking efficiency?
Tools like AnyPost.ai streamline KPI tracking by automating data collection and reporting, reducing manual effort by up to 40%. This allows marketers to focus on strategy rather than spreadsheet work. For example, the article mentions how such tools standardize tracking methods, ensuring consistent measurement logic. By automating metrics like bounce rates or MQLs, teams can identify underperforming areas quickly—such as a 20–30% conversion boost after fixing a high bounce rate on a landing page. These tools also integrate real-time insights for agile campaign adjustments.
4. How do KPIs help align marketing and sales teams?
KPIs like Marketing-Qualified Leads (MQLs) and lead-scoring metrics create a shared framework for marketing and sales alignment. For instance, the article describes a B2B SaaS company that increased demo sign-ups by 35% after refining lead-scoring KPIs. Sales teams can prioritize leads that are 50% more likely to close, while marketing adjusts strategies to generate higher-quality MQLs. This alignment ensures both teams work toward the same revenue goals, avoiding wasted efforts on low-potential leads.
5. What challenges arise from using vague metrics like "brand awareness"?
Vague metrics like "brand awareness" lack clear benchmarks, making it hard to assess impact or allocate budgets effectively. The article explains that KPIs eliminate this ambiguity by providing actionable data. For example, tracking social media engagement rates or website traffic growth offers concrete insights into brand visibility. A high bounce rate, a specific KPI, signals poor user experience, which can be fixed to improve conversions. By replacing vague metrics with measurable KPIs, teams avoid guesswork and focus on outcomes that drive growth.
6. How do KPIs help optimize ad spend for businesses?
KPIs like CAC and Marketing ROI enable businesses to identify underperforming ad channels and reallocate budgets strategically. The article cites a retail brand that saved 50% on ad spend by analyzing KPIs to eliminate low-performing campaigns. By tracking metrics such as conversion rates and CTR, marketers can pinpoint high-yield channels and adjust bids or creative assets in real time. This data-driven approach ensures every ad dollar contributes to revenue goals rather than being wasted on ineffective placements.