
What Are the Best Automated SEO Reporting Tools for Teams?

Key Takeaways
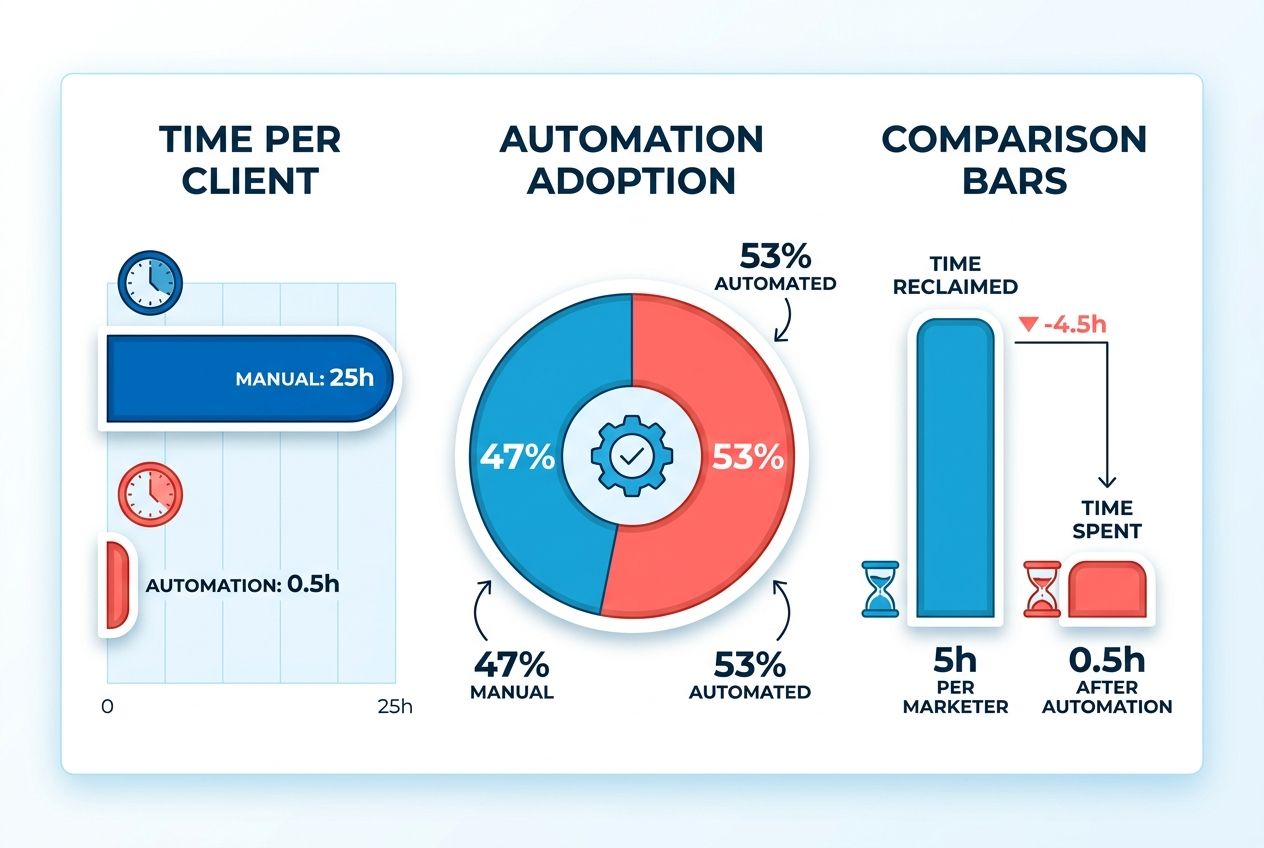
- Manual SEO reporting eats 20-30 hours per client each month. Run 10 clients, and you're bleeding roughly 300 hours monthly into data collection.
- Automation pulls Google Search Console, GA4, and third-party metrics into one dashboard. It refreshes on a schedule, cutting grunt work to minutes.
- Standardization beats speed. When every report follows the same schema, ranking drops glow red instead of hiding three tabs deep.
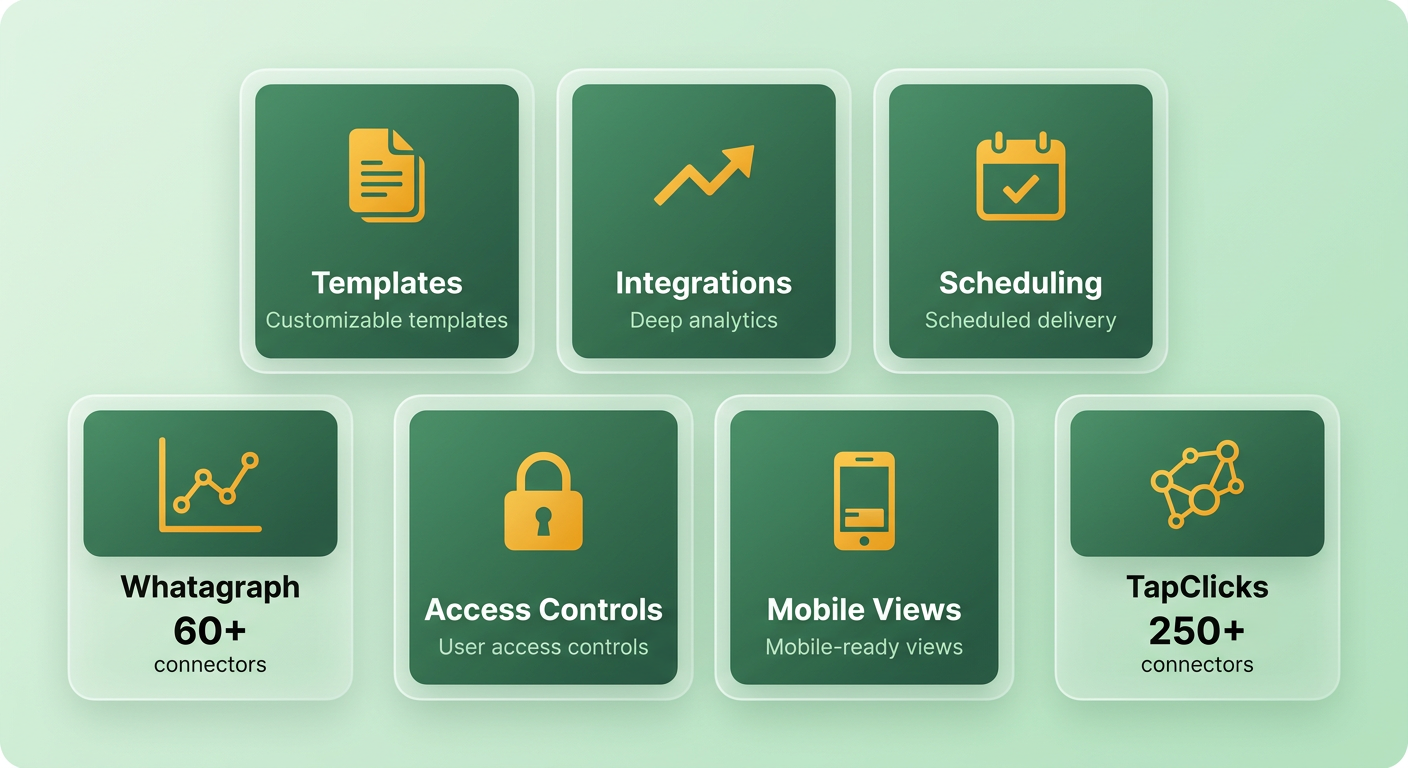
- Connector count stopped being a moat. Whatagraph ships 60+ native integrations, and TapClicks tops 250. Raw data is a commodity now.
- Maeva Cifuentes at Flying Cat Marketing clawed back an extra 20 hours monthly by layering AI-generated summaries over automated data pulls.
- Automation and AI narration are separate wins. One removes collection overhead; the other removes copywriting overhead.
- Clients care about traffic and revenue, not vanity metrics. A line like "organic clicks rose 18% while conversions dropped 9%" answers what changed and why.
Quick Summary
Automated SEO reporting gives you time back, consistent insight, and reports that read like stories. Pull Search Console, GA4, and SEO metrics into one scheduled dashboard, and you skip the login-hopping ritual across five disconnected platforms.
The bigger payoff is standardization. When every report follows the same schema, anomalies surface fast. A ranking drop that would vanish in a spreadsheet lights up in a dashboard tied to your KPIs.
The second bottleneck is turning that data into a narrative that sounds like your brand. Because raw numbers are now a commodity across every major platform, the differentiator is whether the report explains what happened or just dumps metrics on the client. Automated summaries layered onto your data pulls close that gap. Collection and copywriting are separate chores, and you can automate both. Nobody has to rewrite the same weekly update by hand.
Comparison Table: Top Automated SEO Reporting Tools
| Tool | Best For | Starting Price | Core Strength | Key Limitation |
|---|---|---|---|---|
| Plerdy | Page-level monitoring | Free / $32/mo | Links GSC data to specific page changes with 30-day history | Not a white-label agency tool |
| Semrush | All-in-one research + reporting | $139/mo ($117.33 annually) | AI-generated report summaries, 12+ templates, daily scheduling | Highest entry price in the lineup |
| Ahrefs | Deep backlink research | $29/mo (Starter) / $129/mo (Lite) | Proprietary database depth, Data Studio connectors | Weak white-label presentation |
| SE Ranking | Agency client reports | ~$65/mo | Custom templates, white-label on supported plans, keyword history | Requires add-ons for full agency features |
| AgencyAnalytics | Multi-client dashboards | $79/mo | Client portals, auto-scheduling, reusable templates | Less proprietary data than research-first tools |
| Whatagraph | Cross-channel presentation | Custom pricing | Visual dashboards, 60+ native connectors, 99.95% uptime | Premium cost for polish |
| Google Looker Studio | Custom free dashboards | Free | Native Google data connections, shareable templates | Significant setup time and expertise required |
Time Savings vs. Setup Cost
Looker Studio is free. But free gets expensive once you count labor. One Reddit user pointed out that building a working dashboard from scratch takes real data expertise and ongoing maintenance. If your scarce resource is time, that setup overhead makes paid automation cheaper in practice. Got an in-house analyst? Looker Studio is a genuine bargain. Drowning in client work? The pre-built integrations pay for themselves inside the first billing cycle.
Ahrefs shows the same tradeoff from another angle. Its $29 Starter plan is the cheapest paid entry among research tools, but that price buys data access, not client-ready output. Ahrefs is a research engine, not a reporting layer. It surfaces the backlink and keyword intelligence you build recommendations on, but you still write the narrative and format the deck. That gap is exactly where AI-narrated dashboards earn their keep. If your workflow is "pull data → draft summary → format slide deck," automation kills the last two steps.
Features Included in Each Tier
SE Ranking's $65/month base covers rank tracking, audits, backlink monitoring, and scheduled reports. White-label branding and custom templates sit behind agency-tier add-ons. AgencyAnalytics flips the priority: its $79/month plan leads with client portals, auto-scheduling, and reusable templates, because agencies running multiple accounts need delivery infrastructure more than they need a deep proprietary database. It connects to GSC, GA, PPC platforms, and social channels, so multi-channel performance lands in one dashboard. When delivery and branding matter more than owning the biggest backlink index, AgencyAnalytics wins.
Plerdy's free tier handles continuous page-level monitoring with GSC integration. It auto-collects on-page SEO data, technical issues, and keyword performance, then exports to Google Sheets. The paid tiers ($32/month, or $21/month annually) add a 30-day change history, so you can tie a ranking decline to a specific page edit instead of digging through disconnected logs. That answers the "what changed" question before the client even asks.
Value Analysis and ROI
Automation compounds ROI in two stages. Stage one is data collection. Agencies pulling metrics from multiple dashboards by hand burn a chunk of every retainer on admin. Automation drops that collection time to near zero. Stage two is copywriting. Even with the data in front of you, drafting performance summaries still costs hours per report. Automated narrative layers handle that step, so teams scale client capacity without hiring more account managers.
The math matters here. 68% of online experiences start with a search engine, and 61% of B2B marketers say SEO generates more leads than any other channel. If reporting overhead caps how many clients you can serve, automation directly lifts that cap.
Google Search Console belongs in every stack, but you usually need another platform to turn GSC's raw query data into something a client can read. Plerdy folds GSC queries, clicks, impressions, and position data into page-level analysis, so you see which landing page drove the change. Semrush layers automated summaries on top of GSC and GA, translating a raw click bump into context about which blog posts pulled in high-intent traffic. That's the jump from data dump to decision support.
Which Tool to Pick
Need continuous site-level monitoring that ties rankings to specific page changes? Start with Plerdy. Want broad research, audits, and scheduled reporting in one place? Semrush or Ahrefs bring the depth. Semrush leans toward turnkey client reports, Ahrefs toward specialist backlink intelligence. If delivery, branding, and multi-account management outweigh proprietary data, AgencyAnalytics fits. If presentation polish and cross-channel views are the priority, Whatagraph's dashboards justify the premium. And if you've got in-house data skills plus time to build, Looker Studio is a legitimate free option.
One G2 reviewer summed up the test well: the best tool answers three questions cleanly. What changed, why it matters, what to do next. Trial your shortlist on one real client before committing, and confirm the report delivers those three answers without someone rewriting the narrative every week.
Why Automated SEO Reporting Matters
The core shift is simple: your team stops assembling data and starts acting on it. When reports build themselves, you get hours back, every metric stays consistent, and you see insight the moment numbers move instead of at month-end. That timing gap is where most strategy stalls.
Organic search is still the highest-ROI acquisition channel for most businesses, yet manual reporting keeps teams stuck in reactive mode. 53% of marketers spend over 5 hours a month on SEO reporting alone, hours that could go to testing, content, or technical fixes. Automate the cycle and those hours move from describing what happened to deciding what's next.
Who Benefits Most from Automated Reporting?
Agencies and in-house teams running multiple properties gain the most. Juggle several client accounts or product lines and manual reporting scales linearly with headcount. Automation breaks that link.
E-commerce teams sharpen up too. The strongest returns show up when reports focus on conversion points from organic traffic, not raw sessions. News and media teams lean the other way, watching impressions and bounce patterns to steer content decisions fast.
Solo consultants win differently. For them, it's not about volume. It's about looking like a bigger operation. Polished, scheduled reports that never miss a delivery do a lot of quiet work.
Why Does AI Narration Change the Math?
Data collection stopped being the hard part. Modern platforms offer huge integration libraries, so pulling Search Console, GA4, and rank data into one view is the baseline everyone meets. The bottleneck moved to interpretation.
That's our angle. Streamlining the commentary is a separate efficiency gain that stacks on top of automated data gathering. Our Persona Engine handles that step by matching your tone automatically, so the write-up never becomes a manual chore bolted onto the data pull.
AI-generated narration writes those summaries in your brand's voice. Instead of a dashboard that shows a ranking dip, you get a report that explains the dip, ties it to the KPI that matters, and reads like your strategist wrote it. Ready to share, with no manual copy step.
It matters more now because clients ask harder questions. This year, they want to know how visible their brand is inside AI answers, not just where they rank on page one. A narrated report answers that in plain language.
Manual vs Automated Reporting
| Dimension | Manual Reporting | Automated + AI Narration | |--|---|----|----| | Data collection | Copy-paste from many tools | Auto-pulled via connectors | | Consistency | Varies by who builds it | Fixed schema every cycle | | Interpretation | Written from scratch | AI summaries in brand voice | | Turnaround | Days, monthly | Minutes, on schedule | | Scales with clients | Linearly with hours | Flat once templated |
Run one site and report quarterly? Skip full automation. The setup won't pay back. Track multiple properties on a monthly cadence and the case makes itself. For a deeper tool breakdown, see our guide to top automated SEO reporting tools.
What Actually Matters When You Evaluate These Tools
Five buckets show up on every feature checklist: customizable templates, deep analytics integrations, scheduled delivery, user access controls, and mobile-ready views. Here's the honest read, though. Connector count is no longer the differentiator. With major platforms shipping dozens or hundreds of integrations, data collection is a solved problem.
The real gap is narration. Raw metrics don't persuade a client on their own, so the value shifts to how well a tool turns those numbers into something someone actually reads. Same principle behind brand-voiced content: numbers only land when they sound like you.
Which template and integration features should you prioritize?
Look for reusable templates plus flexible connections, not one or the other. The ideal platform lets you save custom layouts for different client tiers while keeping live data feeds running.
Our take: templates save setup time, but integrations decide whether the report tells the truth. A tool that blends analytics, keyword, and backlink data into one schema catches anomalies that a single-source view hides.
How does AI narration change the reporting layer?
Automating the narrative layer clears the last bottleneck in the pipeline. The time saved isn't from faster data syncs. It's from skipping the manual write-up, the same choke point that makes content production slow. That's the problem AnyPost solves on the content side: our Persona Engine captures your brand's voice so every article reads like you wrote it, no manual drafting.
Auto-collected metrics still need a human-sounding explanation of what shifted. AnyPost applies that same brand-voice consistency across every article and platform, so you hand readers a ready-to-share insight instead of generic copy they scroll right past.
What about scheduling, access controls, and mobile?
Automated email scheduling, granular permissions, and mobile-optimized views are the baseline now. Access controls let you hand a client read-only dashboard views without exposing account settings. Mobile rendering matters because executives check numbers on their phones, not a desktop PDF.
A stance worth taking: free tools look economical until you count setup labor. If your scarce resource is time, paid automation with built-in efficiency is cheaper in practice.
One more filter before you commit: check export formats and refresh cadence. Tools that only refresh on a fixed daily pull can lag live campaign shifts, while ones offering on-demand syncs plus both PDF and live-link sharing give you room to move when a client asks for numbers mid-month. Support responsiveness counts too. A stalled connector on report day costs you more than any feature list buys back.
Match the tool to your bottleneck. If yours is interpretation, prioritize the narration layer. If it's producing content that sounds like you at scale, that's what AnyPost's brand-voiced generation is built for.
Tool 1: Semrush — the all-in-one that reports in its own voice
Semrush earns the all-in-one slot: research, rank tracking, site audits, backlink analysis, and scheduled reporting all live under one login. If you want SEO reporting inside a single platform, this collapses the most workflows into one place. Its My Reports builder handles drag-and-drop layouts, daily-to-monthly scheduling, PDF export, GA and GSC integration, and white-label branding.
The interesting bit for our angle is its AI-generated report summaries. Semrush already turns raw metrics into written takeaways, which is exactly the narration layer that separates a data dump from a report a client reads. The catch: those summaries speak in Semrush's voice, not yours. That's the seam where a dedicated brand-voice layer adds value on top.
What does Semrush do best for reporting?
Best for teams that want research, tracking, auditing, and scheduled client reporting without stitching four tools together. Semrush pulls its own keyword and backlink database alongside GA and Search Console, so a single report can show rankings, traffic, and link movement side by side.
The technical side is genuinely deep. Site Audit flags crawl issues. Position Tracking watches keyword movement over time. Pair that with the AI summaries and you get scheduled reports that explain shifts, not just chart them. That gives clients the context they need to read a trend without waiting on manual analysis.
How strong is competitor analysis?
Competitor research is where Semrush pulls ahead of narrower tools. You can grab a rival's organic keywords, traffic estimates, and backlink profile, then drop that comparison straight into a scheduled report. The domain overview shows estimated monthly visits, top landing pages, and the paid-versus-organic split, context that helps explain why a competitor ranks where they do.
You can also track up to 20 competitor domains at once in Position Tracking projects. So your monthly report shows not just your own ranking shifts but how the whole top-ten moved. When a client asks why they dropped two spots, you can point to three competitors who launched new content that month and gained velocity in the same keyword cluster.
What workflow fits Semrush best?
Semrush makes sense when the person running keyword gap analysis also assembles the client deck. If your team splits research and reporting between roles, analyst pulls data, account manager writes the summary, connector-based dashboards like Looker Studio or AgencyAnalytics often fit better. But if you want to move from "here's what the competitor is doing" to "here's the slide explaining it" without switching tools, Semrush keeps that path smooth. Fewer handoffs, less copy-paste, and the report reflects the same research session that shaped your strategy.
Skip Semrush if reporting is your only need. You'd pay a research premium for features you won't touch, and cheaper scheduled-report tools cover that job for less. But if your team runs keyword research, audits, and client updates from one seat, the bundle math works. The honest gap is voice: Semrush narrates in its own register, so teams that need reports reading in a client's brand tone still layer a narration tool on top. For more on matching tools to your workflow, see our roundup of tools.
Tool 2: Ahrefs — a research engine that won't talk to your clients
Ahrefs is a research engine first, a reporting tool second. It runs on a deep proprietary backlink and keyword database and pipes that data into scheduled email reports and Data Studio connectors. If you want SEO reporting where the data itself is the selling point, Ahrefs answers with the richest raw numbers behind every recommendation.
Here's the honest read. The low entry tier buys research access, not client-delivery polish, and the mid tier adds seats and higher report limits without changing that core tradeoff. The platform crawls over 15 billion pages a day to keep its index fresh, so the numbers are current, but they land as tables and charts, not finished commentary. It's lighter on white-label presentation than tools built for agency handoff. That gap between deep data and thin narration is exactly where brand-voiced content generation earns its keep.
What Does Ahrefs Do Best?
Ahrefs excels at backlink analysis, competitor research, and content gap discovery. Its referring-domain reports, organic keyword data, rank tracker, and site audit give SEO specialists the evidence layer most other tools lack. You get the "why" behind a ranking shift, not just the shift.
The content gap feature is the standout for growth teams. It shows which keywords competitors rank for that you don't, turning a vague "we need more content" into a specific target list. Pair it with backlink tracking and you can spot when a lost link causes a position drop, then act before the traffic bleeds.
Where the automation stops short
The benefit stalls at the last mile: turning Ahrefs' data into a story a client reads. Scheduled emails and Data Studio exports move numbers, but they don't narrate them in your voice. You still write the performance summaries by hand.
That's the interpretation phase begging to be streamlined. Ahrefs handles collection; translating those metrics into client-ready insight stays manual. Feed its exports into a content platform built around your brand voice and you close that seam, turning raw analytics into polished narrative without starting from scratch every time.
How Does Ahrefs Compare?
| Tool | Best for | Data depth | Narration layer |
|---|---|---|---|
| Ahrefs | Backlink & competitor research | Deep proprietary index | Manual. Data-first, light on client polish |
| AnyPost.ai | SEO-optimized content in brand voice | Pulls from your connected sources | Automated content generation with tone matching |
Pros: unmatched backlink and keyword database, strong content gap analysis, frequent index updates, solid rank tracking and site audits.
Cons: thin reporting layer, limited white-label branding, no native brand-voiced narration.
Our recommendation: pick Ahrefs when your scarce resource is research depth and you've got someone to write the story around the numbers. If your bottleneck is the copy, keep it as your data source and layer automated content generation on top. It's a data engine worth owning. Just don't expect it to talk to your clients for you.
Pros and Cons — the balanced read
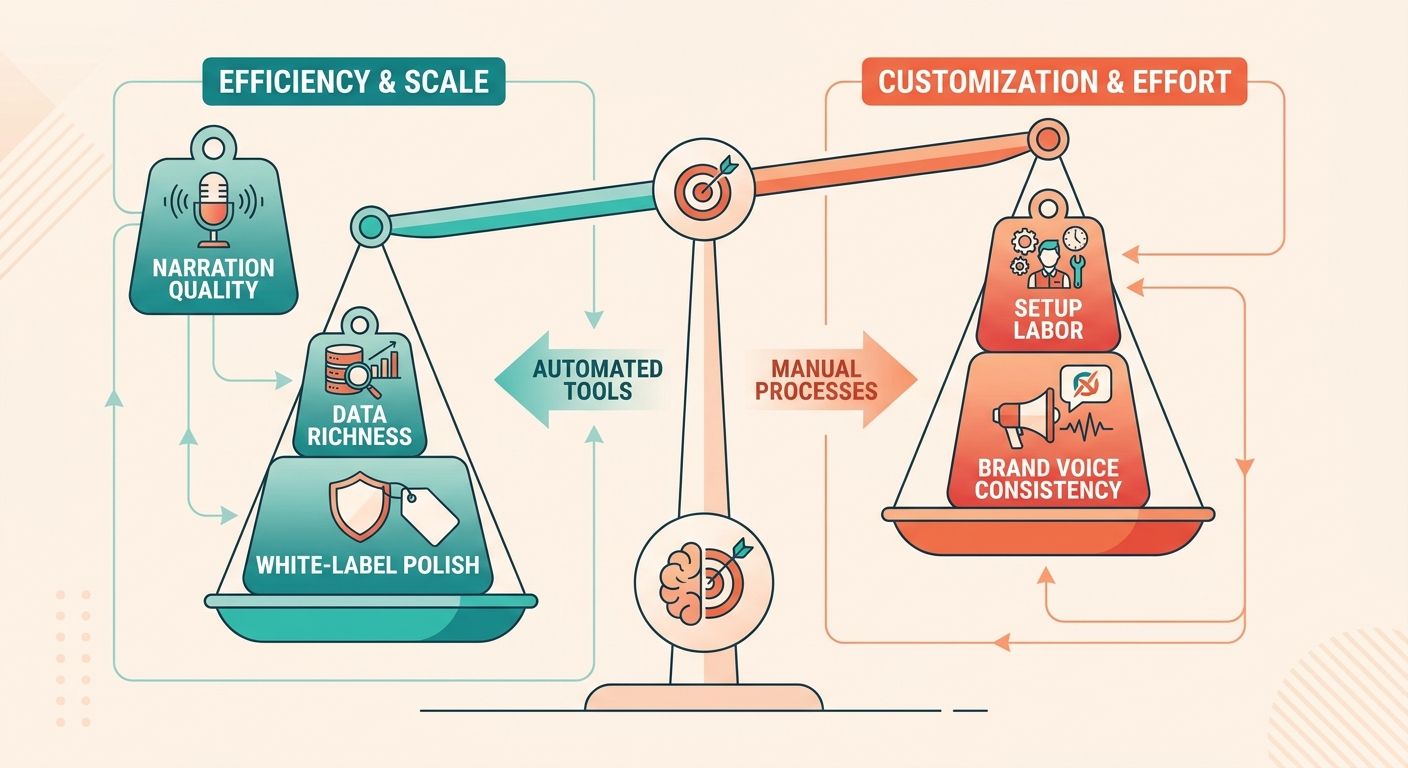
The honest read on any tool roundup: no single platform wins every category, and the biggest benefit isn't buried in a feature list. It's how well the tool turns collected numbers into a story your client reads. Once you've compared pricing and connectors, that narration gap is what separates the picks.
The real tradeoffs show up in white-label polish, setup labor, and whether the tool speaks in your voice or its own. Data collection is a commodity now.
Which Tool Fits Which Team?
Match the tool to your scarcest resource, whether that's budget, time, or client-ready polish. If client delivery is your bottleneck, prioritize white-label depth and template range. If page-level monitoring is the job, prioritize change history and search-console ties. If you've got in-house data skills, a build-your-own dashboard pays off. If the friction is explaining results, a narration-first tool earns its place.
A useful test: count how many hours per report go to gathering data versus writing the takeaway. Teams that already automate collection usually find the writing is now the slower half. That single ratio tells you which category to shop in before you compare features line by line.
Watch the hidden-cost patterns too. Some platforms advertise a low entry tier, then move white-label branding, extra seats, or added connectors into paid add-ons. A base price can double once you switch on the features an agency actually needs, so read the tier that matches your real usage, not the headline number.
Is "Free" Actually Cheaper?
Not always, and this is where the sources openly disagree. Some practitioners treat free custom dashboards as a legitimate best-fit choice. Others warn that building these views demands real setup time and expertise.
Both are right, depending on your bottleneck. In-house data skills? A free dashboard is genuinely economical. Time-constrained? The setup overhead makes paid automation cheaper in practice.
What Do Users and Experts Actually Complain About?
The recurring gripe: reports that show metrics but don't explain them. Clients care about business outcomes, not vanity metrics.
That's why the narration layer matters. The best reports communicate meaning, not just numbers. The second complaint is time. Agencies running dozens of client reports a month describe writing summaries as the task that quietly eats their afternoons, long after the dashboards refresh on autopilot.
Notice what that pattern proves. Automating the data pull is only half the battle. Writing the explanation is a separate bottleneck. That's the case for a tool built to write dashboard insight in your brand's voice instead of a generic template.
Skip a premium platform if you run one or two sites and just need rankings. Reach for narration-first tools when client communication, not data access, is your real friction.
Best Practices for Implementing Automated SEO Reporting
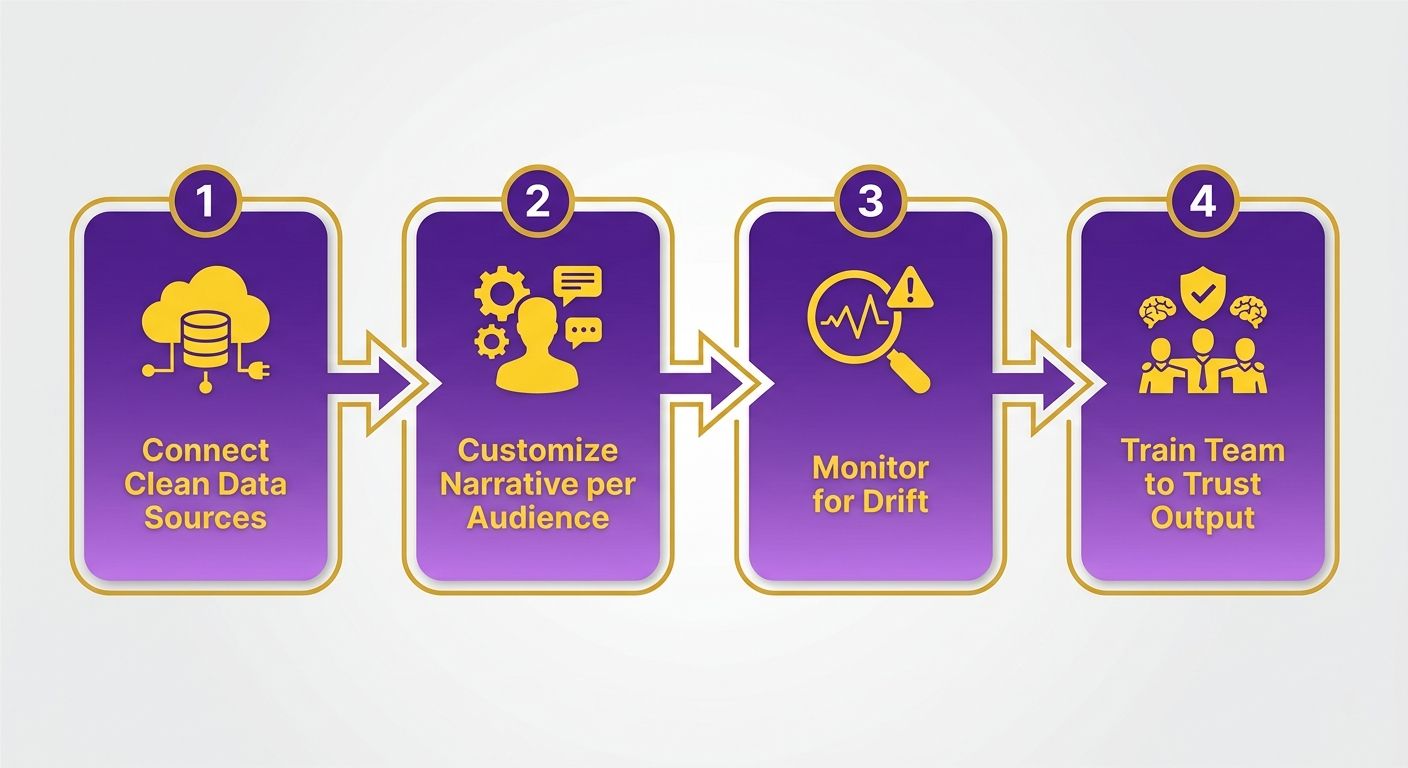
Getting this right comes down to four moves: connect clean data sources first, customize the narrative per audience, monitor for drift, and get your team to actually trust the output. Skip any one and the benefits shrink fast. You end up with a dashboard nobody reads.
Here's what we've seen watching content teams roll this out. The setup phase decides everything. Teams that standardize their metric schema before the first scheduled send cut downstream rework dramatically. Teams that automate first spend the next quarter reconciling mismatched definitions. The payoff only shows up once everyone agrees on what a "click" or a "conversion" actually means at the source.
How Should You Handle Initial Setup and Configuration?
Start with data sources, not templates. Anchor on one authoritative free feed, then layer analytics and a third-party SEO tool on top. A single feed alone gives you no white-label output and no conversion attribution, so you need a reporting layer above it to stitch the picture together.
Nail this foundation early and you head off data discrepancies later. Map your primary data streams to one centralized reporting layer, and every downstream visualization draws from a single source of truth. Less manual troubleshooting, fewer arguments about whose number is right.
Customizing Reports for Specific Needs
Match the report to the vertical, not a fixed template. Different business models need different KPI focuses. A layout tuned for lead generation will miss the nuances of a publisher's traffic patterns. One layout can't serve both well.
That's the wall multi-client agencies hit. A static white-label template forces every account into the same story. Brand-voiced AI narration outperforms fixed templates here, because the commentary adapts per business type and speaks in each client's voice, so the numbers land instead of reading like a generic export. AnyPost.ai's Persona Engine matches your brand tone across content, keeping reporting commentary consistent with how you already talk to clients.
Ongoing Monitoring, Training, and Adoption
Automation isn't set-and-forget. Schedule a monthly check on connector health and metric definitions. Clients in 2026 ask harder questions about traffic shifts and brand visibility inside AI answers, so your reports need to evolve with those questions instead of freezing in place.
Adoption is the quiet failure point. A report your team doesn't trust gets ignored. Train people on how the AI narration is generated and let them edit the voice early, so it reads as yours from day one.
| Implementation Phase | Best Practice | Watch Out For |
|---|---|---|
| Setup | Connect your core feeds, standardize KPIs first | Automating before agreeing on metrics |
| Customization | Adapt reports per vertical and brand voice | One static template for all clients |
| Monitoring | Monthly connector and definition checks | Frozen reports missing AI-search questions |
| Adoption | Train team, let them shape the narration voice | Dashboards nobody reads or trusts |
The through-line: data collection is solved. The lasting win is a report that narrates performance in your voice and gets read.
What I'd Actually Recommend
Match the platform to what you're short on. If time is the bottleneck, AgencyAnalytics and Whatagraph automate the whole client handoff, and pairing dashboards with AI narration is one way teams reclaim hours once collection is done. If budget is tight, start with Google Search Console and Data Studio. You'll spend setup hours instead of subscription dollars, but the output flexes enough to scale. If brand voice is the priority, that's where our platform enters the conversation.
We built AnyPost.ai to close the brand-voice gap that generic AI content leaves open. Semrush generates summaries, but they speak in Semrush's voice. Ahrefs gives you deep backlink data, but the reports stay clinical. Our Persona Engine crawls your entire site to build a Business Context Graph of your products, messaging, and audience, so every article sounds like you wrote it. Define your voice once and the system produces ready-to-rank, SEO-optimized content and auto-publishes it across WordPress, LinkedIn, and X. For content teams running multiple clients, that's the piece that closes the loop: consistent brand voice plus hands-off publishing in one workflow.
Trade-Offs You'll Actually Face
No platform wins every category. Some tools prioritize cost-effective white-label exports, others focus on visual dashboard depth or huge integration libraries that may exceed what a smaller team needs. Choosing a free dashboard builder means weighing zero licensing fees against the internal hours to maintain it. The right tool matches your reporting goal, not the longest feature list.
What's Coming Next in Automated Reporting
The shift we're watching: tools moving from metric aggregation to interpretation. Across the industry, clients increasingly care about business outcomes over vanity metrics, and that's driving the next generation of reporting features. AI summaries are the baseline now. The platforms winning in 2026 are the ones that explain performance shifts clearly, name the underlying causes, and outline actionable next steps. If a tool only shows you numbers, it's solving yesterday's problem.
Still building manual reports? Start with one automation layer and expand. Connect your GSC data to a free dashboard, then add scheduled delivery once the schema is stable. For agencies with multiple clients, budget for a platform that handles white-label branding and client portals. The time savings pay for the subscription in the first month. And for content leaders who need ready-to-rank content in their own voice without hiring a writer, that's the gap our platform closes, generating and publishing SEO-optimized articles that sound like you.
Frequently Asked Questions
1. Can I use a free tool like Looker Studio and still get the same time savings as paid automation?
Free tools work only if you have in-house analysts with time to build and maintain dashboards. For agencies drowning in client work, the setup labor makes free options costlier than paid platforms in the long run. Paid tools eliminate the initial build time and ongoing API maintenance, allowing teams to realize time savings immediately.
2. If Semrush already generates AI report summaries, why would I need a separate narration layer?
Standard platform summaries typically use generic templates and default tones. A separate narration layer allows you to customize the output to match your agency's specific communication style. This ensures that the automated commentary sounds like it was written by your account team rather than a software algorithm.
3. Should a solo consultant with one client bother with automated reporting?
If you manage a single property and only report on a quarterly basis, the initial setup time for automation may not be justified. However, if you plan to scale your client list, establishing automated templates early allows you to maintain professional delivery standards without increasing your administrative workload as you grow.
4. Which tool answers "what changed" before a client even asks?
Look for tools that offer page-level change tracking. By monitoring on-page updates alongside search performance, these platforms help you immediately identify whether a drop in rankings was caused by a recent content edit, a technical issue, or an external algorithm shift.
5. Is Ahrefs' low $29 Starter plan a cheap way to get client-ready reports?
Entry-level research plans are designed for data analysis rather than client presentation. While they provide access to valuable backlink and keyword databases, they lack the automated formatting, scheduling, and white-labeling features needed to send reports directly to clients without manual preparation.
6. How is AI narration different from just having more data connectors?
Data connectors simply move numbers from one platform to another, solving the collection phase of reporting. Narration addresses the interpretation phase by translating those numbers into written insights. The primary time savings from narration come from automating the written analysis that explains performance trends to stakeholders.
7. What should I test before committing to any reporting tool?
Run a trial using a single active account to evaluate the platform's real-world performance. Verify that the automated output provides clear, actionable insights that require minimal editing. Additionally, test the reliability of the data syncs, the flexibility of the export options, and the responsiveness of customer support.