
Ahrefs Reporting Software in 2026: Build Client Dashboards With Reports, Rank Tracker, and Site Explorer

Key Takeaways
- Three Ahrefs modules, Site Explorer, Rank Tracker, and Reports, form the backbone of a client-facing SEO dashboard when configured together.
- Rank Tracker monitors keyword positions across approximately 170 countries with up to five competitors tracked simultaneously per project.
- Site Explorer refreshes backlink and organic traffic data regularly, so dashboard freshness matters.
- The Reports builder is currently in beta and free on all paid Ahrefs plans, using a widget-based system to assemble client dashboards from Site Explorer and Rank Tracker data.
- Setup complexity varies significantly by module, from beginner-level for the Reports builder to advanced for full Site Explorer configuration.
- Rank Tracker supports either daily or weekly position updates depending on plan tier, with automated email reports available to cut manual delivery work.
- Agencies that automate the repetitive data-collection layer and reserve human judgment for client-facing interpretation get the most out of this reporting stack.
Quick Summary
Building an Ahrefs client dashboard comes down to three modules working together: Site Explorer for competitive and backlink intelligence, Rank Tracker for keyword position monitoring, and the Reports builder for packaging it all for clients. Get these three configured and you have the backbone of any client-facing SEO dashboard.
This stack rewards agencies that automate the repetitive parts and save judgment for the client-facing layer. The dashboard is only as useful as the freshness of the data feeding it, so keep that front of mind before investing heavily in configuration.
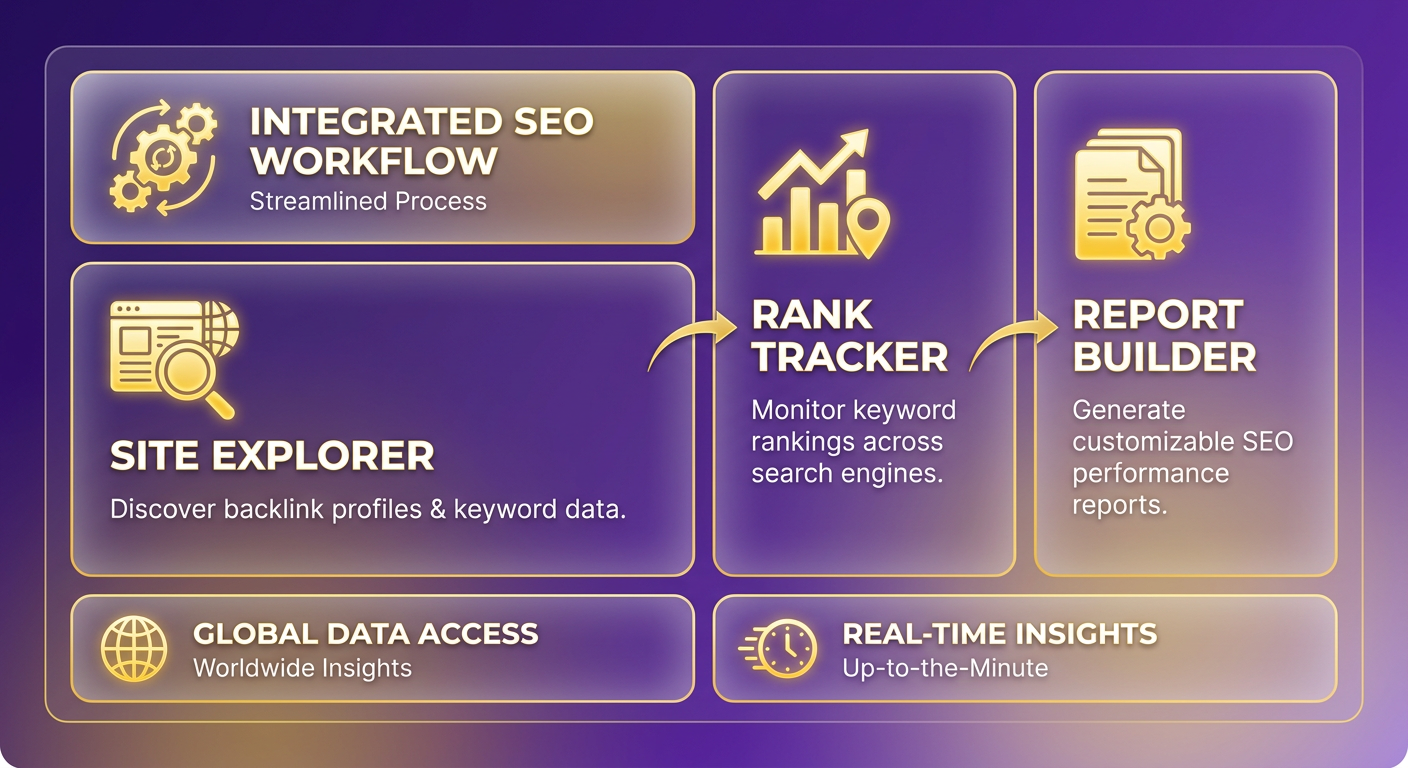
What Each Ahrefs Module Actually Does
| Module | Core Function | Setup Time | Automation Capability | Typical KPI Impact |
|---|---|---|---|---|
| Site Explorer | Backlink profile, organic and AI search traffic, competitor analysis | Longer. Most configuration up front | Metrics refresh every 24 hours; portfolios aggregate multiple URLs | Referring domains, organic traffic visibility |
| Rank Tracker | Keyword position tracking across ~170 countries, up to 5 competitors | Moderate. Keyword and competitor entry | Daily or weekly updates by plan; automated email reports | Position gains, SERP feature capture |
| Reports | Custom client dashboards built from Site Explorer and Rank Tracker widgets | Fast once data exists | Beta, free on all paid plans; widget-based, currently static | Reporting accuracy, client onboarding speed |
Skill level runs from beginner for the Reports builder to advanced for full Site Explorer configuration. Reviewers consistently flag a real learning curve on the deeper modules, particularly Site Explorer's competitive intelligence and technical audit features, while the Reports builder is widely considered the most accessible entry point.
Where This Actually Saves Agencies Time
The payoff is in managing many clients at once. Agencies using Ahrefs report better efficiency across multiple client accounts thanks to customizable reporting and dashboard features. Portfolios let you monitor URLs from different domains and read aggregated organic traffic and backlink numbers in one place.
Longer Google Search Console history is useful for showing trends over time. For voice-optimized content that takes months to compound, that longer memory is where the story lives.
What to Actually Do With This Stack
- Start with Reports, layer in the rest. The builder is beginner-friendly and free on paid plans, so you get a client-visible dashboard fast, then deepen it with Site Explorer intelligence.
- Treat the widget ceiling as a limit, not a target. A workspace allows up to 50 reports and 200 widgets, with 50 per report. Curate for the client.
- Track rankings as signals, not scores. Set up automated email reports and competitor tracking, then act on movement instead of just watching it.
- Watch for staleness. Report widgets are static, but AI-era visibility metrics shift constantly. Build in a way to flag when a client's standing has moved since the last report.
- Use the GSC history. The beyond-16-month data window is an underused advantage for showing long-run content performance.
Skip a heavy multi-module dashboard for a brand-new client with almost no ranking data. There's nothing to report yet. Start lean and expand as the numbers come in.
Why Ahrefs Reporting Still Matters in 2026

Client expectations changed fast. Marketing teams and agencies now want live dashboards, not month-end PDFs, and the data behind them has to hold up under scrutiny. A unified Ahrefs reporting stack matters in 2026 because it pulls competitive intelligence, keyword tracking, and client-facing reports into one source of truth.
The scale is what makes this data anchor-worthy. Ahrefs tracks 41.9 billion keywords against a web index of 170 trillion pages, and many Fortune 500 marketers use the platform. When rank-tracker insights feed straight into published content, that depth is what makes the resulting output defensible rather than guesswork.
The Actual Reporting Problem This Solves
The core problem is manual reporting time. Agencies juggle multiple client accounts, and pulling numbers by hand into slide decks eats hours every week. Ahrefs addresses this by letting you build customizable reports once and refresh them automatically.
Target Internet's 2026 review notes that agencies see improved efficiency managing multiple client accounts thanks to Ahrefs' customizable reporting and dashboard features. That operational lift matters most for automated workflows where rank-tracking movements feed directly into content production without requiring manual spreadsheet entry.
One keyword-count wrinkle worth flagging: Ahrefs' own homepage claims 41.9 billion keywords, while Target Internet cites a database of over 28 billion keywords across 200+ countries. These likely measure different things. The higher figure is probably total indexed keywords; the lower one likely counts keywords with meaningful per-country data. Lean on the self-reported number for scale, but expect third-party audits to land lower.
Why Static Reports Break Down in 2026
Static reports are a snapshot. AI search made snapshots dangerous. Citations in AI answers shift constantly, so a dashboard that shows a citation count without a volatility indicator can mislead a client into thinking a win is permanent when it isn't.
Ahrefs built its own AI marketing platform in-house, and its data shows AI Overviews cutting clicks on triggering keywords. The conclusion that follows: the next generation of client dashboards has to treat AI Overview impact as a first-class metric, not a bolt-on widget.
This is also where the "cheaper tools are good enough" argument breaks down. Ahrefs is positioned as a premium platform, and features like Brand Radar reflect its focus on AI visibility tracking alongside deep backlink analytics. As Target Internet put it in their 2026 review, Ahrefs is "one of the most powerful SEO platforms available," particularly for technical SEO and competitive intelligence.
When to Skip the Unified Stack
Skip the full Ahrefs stack if your work is mostly local SEO or you need a gentle onboarding experience. Target Internet is blunt that Ahrefs is not the best fit for users wanting a friendlier interface or strong local capabilities, and the learning curve is real.
For everyone else running data-driven SEO at scale, the case holds. The value isn't the raw tool. It's turning rank-tracker insight into published content and looping the results back where clients can see them.
The Three Tools That Actually Build Client Dashboards
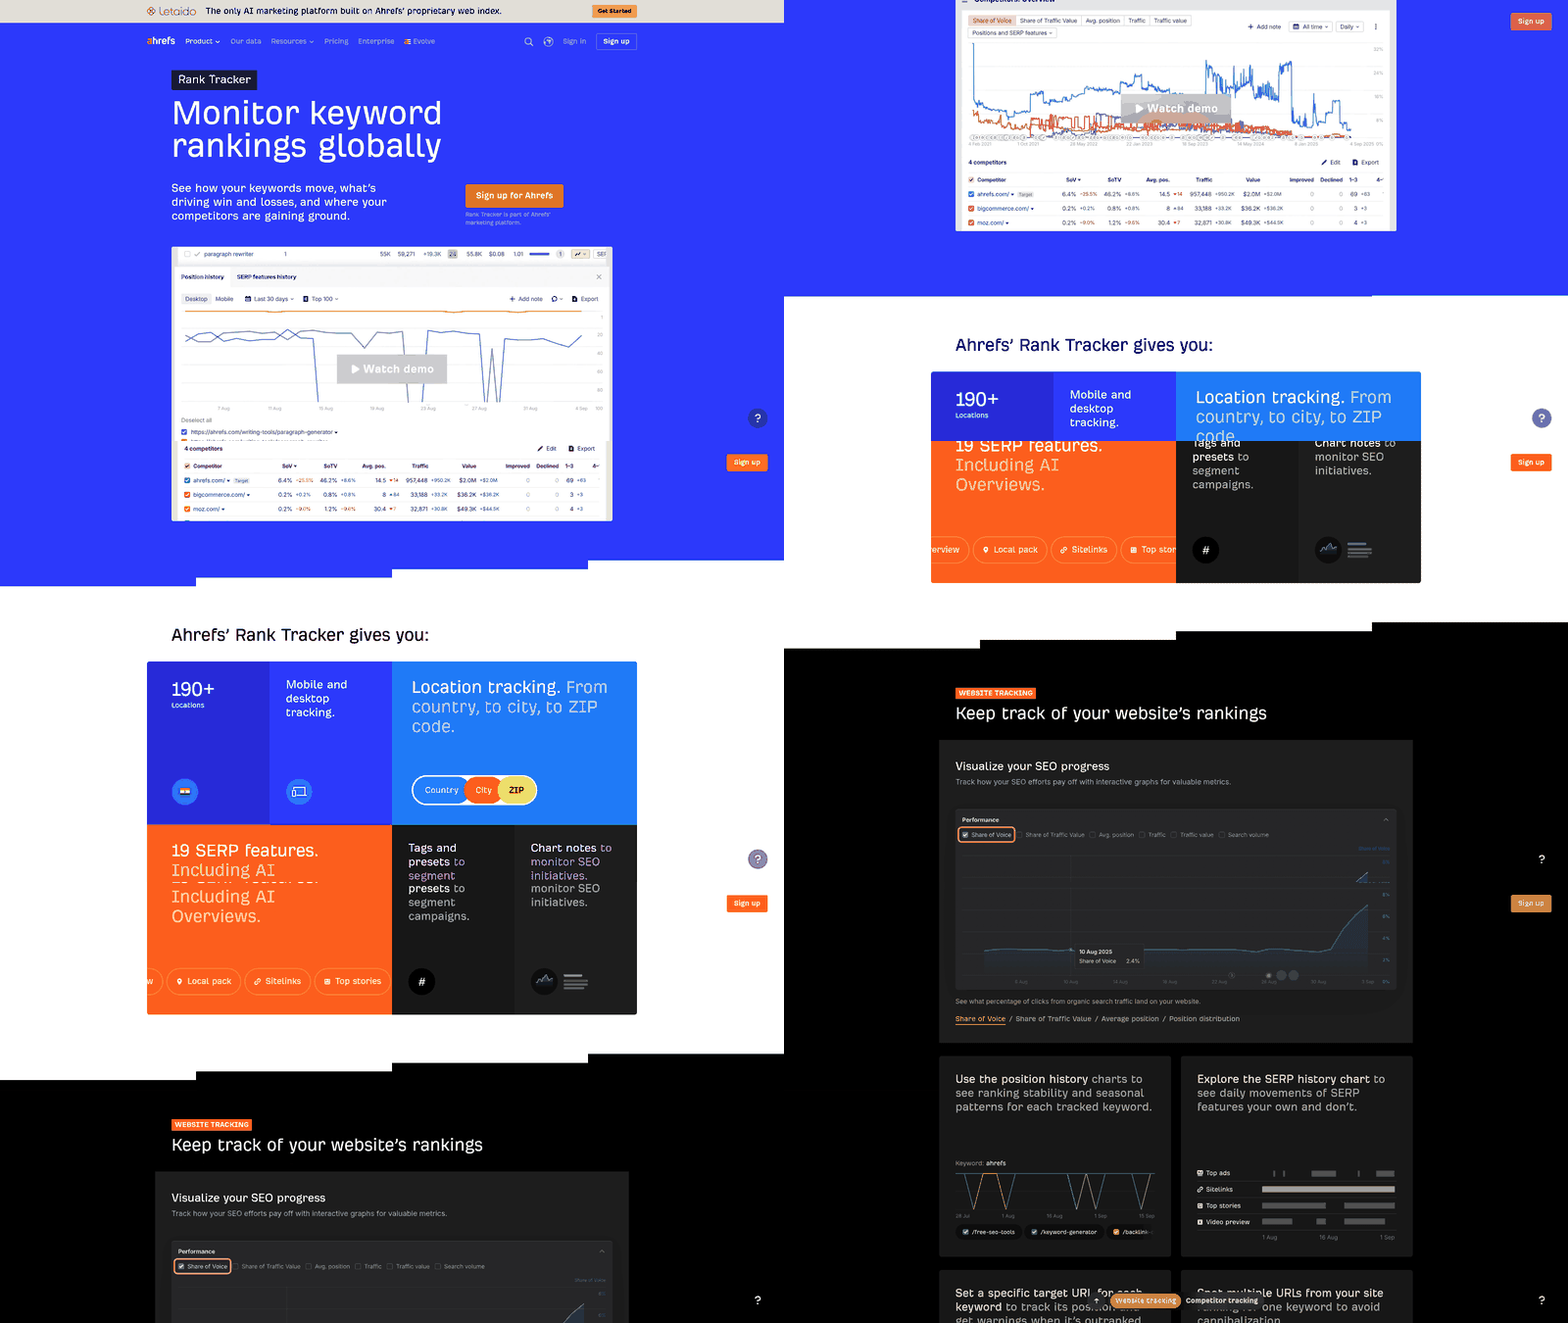
When you set up Ahrefs as a reporting foundation, three tools do the actual work: Site Explorer, Rank Tracker, and the Report Builder. Each is a distinct data layer, and the dashboard only pulls its weight when all three feed into a connected output.
What Each Tool Measures
Each tool answers a different question for the client. Site Explorer answers "how do we stack up competitively?" Rank Tracker answers "where are we in the SERPs right now?" Report Builder answers "how do we present this in a way the client can act on?"
Site Explorer gives you the competitive and backlink intelligence layer. Analyze a competitor's organic traffic, their backlink profile, and how their paid strategy is structured, all from a single domain entry. The tool also exposes SERP feature presence, so you can filter by whether a keyword triggers a featured snippet, an AI Overview, or a local pack.
Rank Tracker is where position data gets actionable. It supports international tracking and positional benchmarking against direct rivals. The tagging system inside Rank Tracker is the piece most agencies underuse: grouping keywords by topic cluster, content type, or funnel stage lets you surface a trend line that means something to a client rather than an unorganized list of hundreds of positions.
Users who rely on Ahrefs daily consistently point to Rank Tracker's tagging and competitor comparison features as what separates it from a simple position-monitoring tool. It helps show how a position moves relative to the competition.
Report Builder is currently in beta and free on all paid plans, including legacy ones. Teams getting the most traction start with five to seven widgets per report and add only when a client asks a question the current layout can't answer. As Dan Delmain, founder of Delmain, puts it: "less is more with client reporting."
One detail for multi-site agencies: each workspace is its own container, so report templates don't transfer automatically across workspaces. You'll rebuild the layout per workspace, which makes standardizing your widget selection early a real time saver.
Getting Data Out of Each Tool for a Dashboard
The most direct route is widget-based. Report Builder pulls from both Site Explorer and Rank Tracker natively, so you can place an organic traffic trend next to a keyword position table without leaving the platform. For teams building dashboards in external tools, Ahrefs exposes data via CSV export from each module, and the API gives programmatic access for teams that want to automate ingestion into a separate visualization layer, whether that's a BI tool or a custom client portal.
One data point worth knowing for agencies running competitive tracking: Ahrefs updates its link index frequently. For dashboards where a client's link acquisition pace is part of the story, that freshness means a new referring domain shows up within hours rather than days.
Turning These Three Tools Into a Live Client View
The dashboard works when rank data connects to content decisions in near real-time. Pairing rank tracker insights with automated content workflows means a keyword moving from position 8 to position 3 triggers a content update cycle, not just a data point in a report.
One structural watch-out: Report Builder's static widget architecture means AI Overview metrics you add today need manual attention to stay current. AI citation data shifts frequently, so those widgets need a freshness check built into the reporting cadence, not a set-and-forget placement. The dashboard infrastructure handles the other pillars well on its own; the AI visibility layer needs a human trigger on top of it.
Choosing Metrics That Actually Mean Something to Clients
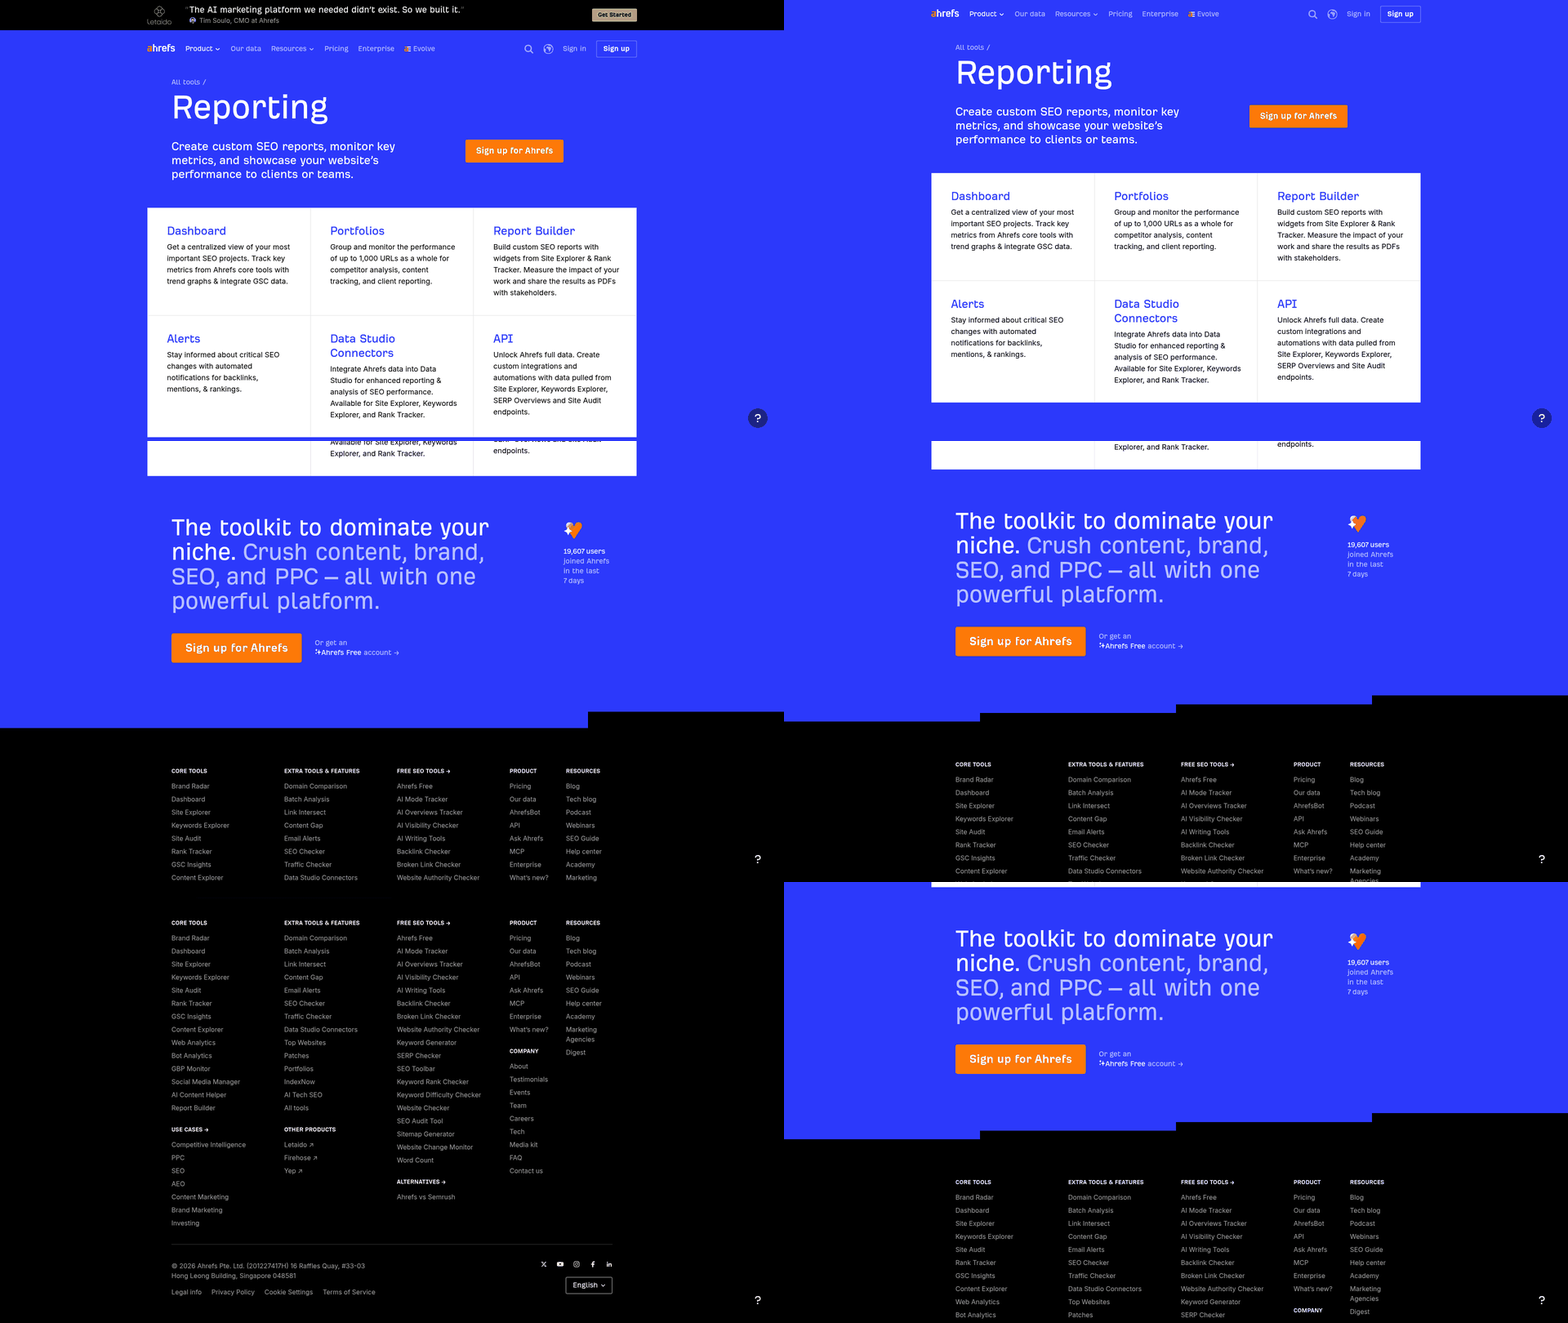
Picking the right metrics is a filtering problem, not a collection problem. The best client dashboards show five to seven core metrics tied directly to what the client is paying you to achieve. Good Ahrefs reporting software gives you hundreds of data points; your job is to throw most of them away.
Start by matching the client type to the goal. An e-commerce client cares about rankings on transactional keywords. A SaaS client cares about traffic to feature and comparison pages. A local business cares about visibility in its specific region. Rank Tracker supports regional segmentation across dozens of international markets, so geographic filtering is where local reporting earns its keep.
Mapping Ahrefs Metrics to Business Goals
Map each metric to one business objective before it earns a spot on the dashboard. If a metric doesn't answer "did we move the needle on the goal," it stays off.
Three common goal alignments:
- Traffic growth: organic traffic trend from Site Explorer plus keyword position changes from Rank Tracker. This is your top-line story for most clients.
- Lead generation: rankings on high-intent commercial keywords, filtered by position. Sam Oh's framing applies here — rankings are signals demanding an analytical response, not numbers to watch drift. A keyword sitting at position 8 is a lead-gen action item.
- Brand authority: backlink profile growth and competitive share. Direct competitor benchmarking turns "are we winning" into a chart the client understands in three seconds.
Different site sizes need different depth. Chris Haines, a Senior SEO Specialist at Ahrefs, calls building a reporting dashboard "a good investment for businesses that want to track their SEO performance." Enterprise clients need dashboards handling data across multiple territories, while a small site needs three metrics and nothing more.
A Reusable Metric-Selection Worksheet
Build a one-page worksheet you fill out before touching any dashboard. It forces the metric-to-goal discipline and stops scope creep.
Three things it needs to cover:
- Client goal in the client's own words. Not "improve SEO." Something like "book more demo calls from search."
- Primary Ahrefs metric that proves movement on that goal. One metric, not three.
- Update frequency the client needs. Position tracking can run daily or weekly depending on account tier, so match the cadence to how fast the client actually reacts.
When ranking changes surface daily, you want a clear line between each tracked keyword and the business outcome it represents. Every shift should immediately point to the next action rather than just describing what happened.
Skip the elaborate worksheet for a tiny affiliate portfolio or a single-location shop. Three metrics on a shared view beats a seven-column template nobody reads.
Automating Report Generation and Distribution
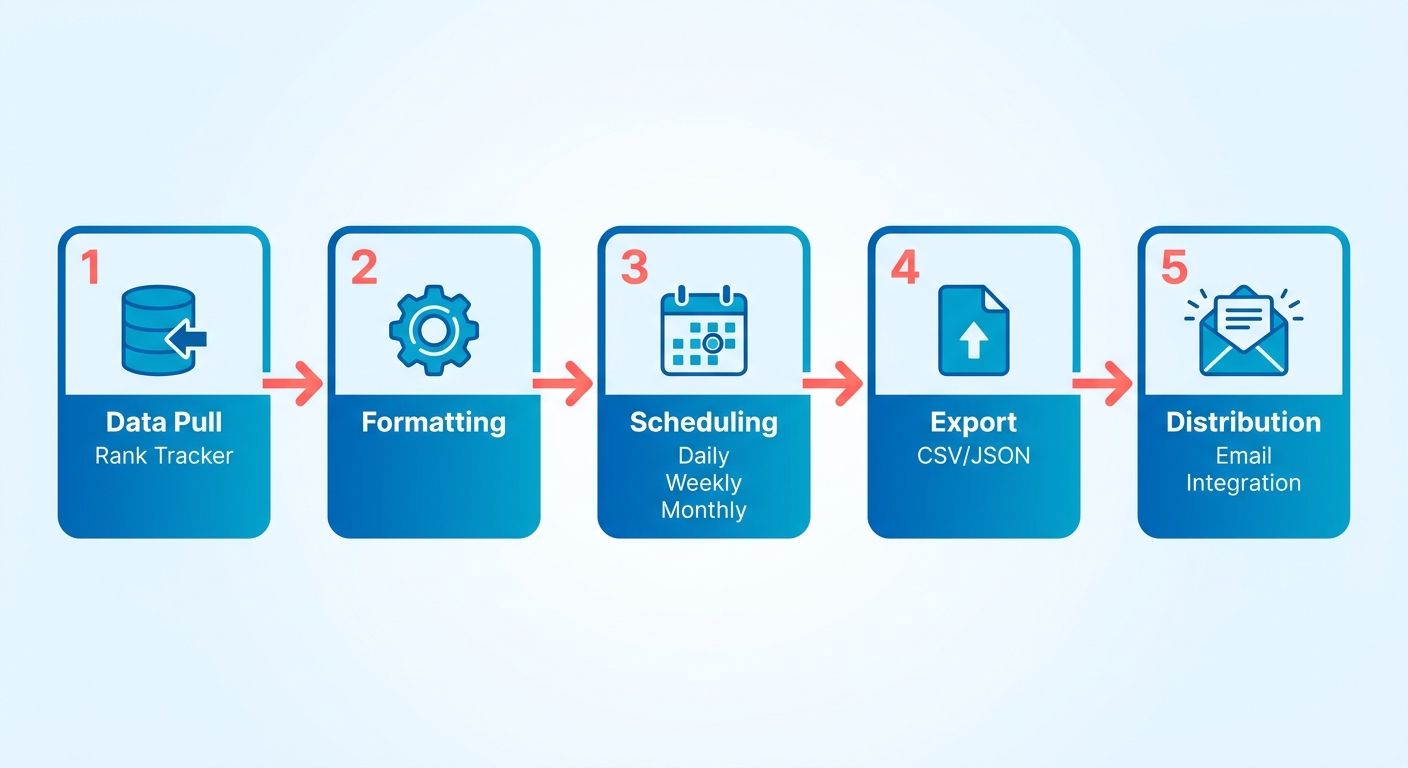
The most time-consuming part of client reporting isn't analysis. It's pulling data, formatting it, and getting it in front of the right people. Ahrefs addresses this through native scheduling, structured data export, and workflow connections that let you replace that manual loop with an automated pipeline.
What Native Scheduling Ahrefs Actually Supports
Rank Tracker includes built-in email reporting for keyword rankings, giving you a recurring delivery mechanism without any third-party setup. Reports go out on your schedule to whoever needs them. The Report Builder handles the dashboard layout directly inside the workspace, but its current architecture requires deliberate planning.
Prioritize clarity over volume when organizing report delivery. An automated rank alert highlighting a handful of high-impact keyword changes alongside key competitor deltas communicates progress far more effectively than an exhaustive breakdown that overwhelms the stakeholder. The accounts with the highest retention typically rely on two or three focused summaries rather than a single monolithic dashboard.
For distribution, the current Report Builder roadmap includes email sharing. Until that matures, Rank Tracker's email alerts handle the delivery layer for ranking data, and CSV export handles everything else.
Building an Automated Pipeline Around Ahrefs Data
The practical automation path combines Ahrefs' structured CSV exports with workflow tools that trigger on a schedule, transform the data, and push it where clients can see it.
A workable weekly pipeline:
-
Schedule a Rank Tracker export on your account's update cadence, whether daily or weekly. The export captures keyword positions, SERP features, and competitor movements for all active tracking slots.
-
Route the CSV through a workflow automation platform using a scheduled trigger. Connect the export to a transformation step that filters to your five to seven agreed client metrics, then push the output to a shared dashboard or client portal.
-
Layer in a Site Explorer snapshot monthly for backlink and domain-level changes. Backlink shifts are slower-moving signals that don't warrant weekly noise.
-
Deliver a client-facing summary through whichever channel the client actually checks: email digest, an embedded web portal, or a shared spreadsheet view. Consistency of delivery always beats visual complexity.
For agencies connecting Ahrefs data to interactive dashboard tools, the CSV structure from both Rank Tracker and Site Explorer maps cleanly to spreadsheet-based dashboard platforms. The column structure is consistent enough to build a repeatable import template rather than reformatting every cycle.
Where the Automation Actually Breaks Down
The Report Builder's static presentation is the operational weak point. Widgets display the data snapshot present during initial configuration. For foundational metrics like organic keyword counts and Domain Rating, that works fine.
AI Overview snippets are different. They fluctuate as algorithm evaluations shift, and a static widget can go stale without visibly indicating that anything changed. When tracking AI visibility for clients, isolate these signals into a dedicated alerting workflow rather than folding them into standard weekly charts. A ranking drop is obvious in a position chart; a missing AI citation requires explicit change detection to avoid misinforming stakeholders.
The automation infrastructure above handles the predictable reporting cycle well. The volatility layer needs a separate trigger, separate cadence, and a clear explanation to clients about why it's tracked differently.
For a deeper look at connecting Ahrefs' export structure to a fully automated content workflow, our guide on SEO automation with Ahrefs covers the integration pattern in more detail.
Dashboard Mistakes Agencies Keep Making (and How to Avoid Them)
The most underused principle in Ahrefs dashboard configuration is also the simplest: the platform's capability ceiling is not your target. Report Builder allows up to 50 widgets in a single canvas, but most stakeholder reviews function far better with eight to twelve. The tension between what the software can display and what clearly communicates progress is where most agency dashboard mistakes live.
Where Setup Goes Wrong

The single most common error is treating the dashboard as a data dump. Rank Tracker gives you positions, volatility, SERP features, visibility scores, and multi-domain competitive tracking. That depth is useful during internal analysis. Presented wholesale to a client, it buries the two or three movements that actually matter this week.
When stakeholders scroll past dozens of disconnected charts just to figure out whether campaign momentum is positive, the reporting interface has failed its core purpose regardless of data precision.
The second consistent mistake is ignoring update frequency when setting client expectations. Rank Tracker updates on account tier. If your report delivery cycle is monthly, you're presenting a thirty-day-old snapshot of data that refreshed yesterday. Ranking shifts that could trigger a content or link-building response get caught a month late. Automated workflows close this gap; manual report cycles cannot.
A Tiered Design Model for Different Client Types
Dashboard architecture should match client scale. For standard mid-market accounts, a focused setup works: five to seven primary KPIs, active competitor tracking, and a layout that avoids widget bloat. Top-line traffic curves, key ranking movers, and high-level backlink velocity fit comfortably without cluttering the screen.
Enterprise programs require a modular approach. Accounts spanning international regions, distinct business units, or multiple subdomains need comprehensive coverage across separate report views. Segment dashboards by geographic market or business line instead of cramming disparate initiatives onto a single canvas.
Five Questions to Run on Any Dashboard Before a Client Call
- Data freshness: Does the report reflect the last Rank Tracker update cycle, or is it pulling from a stale export? Check the timestamp before sending.
- Metric-to-goal alignment: For each widget on the page, can you state in one sentence why that metric matters to this client's specific business goal? If not, remove it.
- Competitor coverage: Are all competitor slots in Rank Tracker occupied by actual search rivals, not aspirational brands outside the client's competitive tier?
- Visual hierarchy: Does the most important metric appear first and largest? A client should understand the story in ten seconds without reading a single label.
- Actionability test: Does each section answer "so what do we do next?" A ranking drop with no adjacent context about which pages or keywords creates anxiety without direction.
Claire Aldridge of Victory Digital puts it plainly: "It has been important for us to have an easy-to-access reporting platform that would put everything in one place for both us and the client." A dashboard that only the agency understands isn't a client dashboard — it's internal documentation with the wrong audience.
For teams building this reporting layer alongside automated content workflows, the connection between rank-tracker data and published content is where the compounding value appears. Positions shift, content responds, and the dashboard captures the feedback loop in real time rather than after the fact.
Case Study: Building an Ahrefs-Powered Dashboard for AnyPost.ai Clients
When we set up Ahrefs as the reporting backbone for a client workflow, the most revealing moment is rarely the initial build. It's the first time a client sees ranking movements happen between reporting cycles and realizes their old monthly PDF had already made that insight stale.
That gap is what this configuration is designed to close.
How We Structure the Build, From Onboarding to Delivery
The build starts with a single filtering question: what is this client actually paying for? A B2B enterprise client tracking demo-request intent requires an entirely different layout than a multi-location healthcare network monitoring local service queries. We define core performance metrics before configuring any Rank Tracker or Report Builder widgets, so every visual element serves a clear purpose.
Once the goal is clear, Rank Tracker becomes the live pulse of the dashboard. We map direct market competitors and configure position refreshes according to the project's service level. Catching a new SERP feature win or identifying a rival's sudden drop mid-week allows for an immediate tactical response, and conventional reporting schedules leave those opportunities untouched for weeks.
Site Explorer handles the domain-level context. We pull organic traffic trajectory and backlink profile health into the same view so the client doesn't have to toggle between contexts to understand why a ranking moved. Unifying position movements with authority metrics on a single screen gives stakeholders immediate clarity on how technical improvements influence visibility.
How Many Widgets Actually Belong in a Client Dashboard?
This is where the tension in Ahrefs reporting is real. The platform provides ample flexibility to assemble dense reports, but practical client engagement demands restraint.
Internal diagnostic work justifies comprehensive data tables and granular backlink breakdowns. In client-facing presentations, a curated set of eight to twelve widgets delivers far clearer direction by keeping high-level commercial outcomes front and center.
For regional or single-site accounts, standard tracking limits offer plenty of headroom without unnecessary noise. Enterprise organizations running multi-language portals or regional subdomains should partition views by market segment to maintain readability across distinct teams.
Where Automated Content Connects to the Dashboard Layer
The dashboard stops being a reporting artifact and starts being a content engine when rank-tracker insights feed directly into what gets written next. When Rank Tracker flags a keyword cluster dropping in position or a SERP feature opening up, that signal shouldn't sit in a report waiting for a human to extract it. The workflow routes those insights into the content creation layer, where voice-optimized articles are generated against the specific gaps the data identifies, then published back into the client dashboard for immediate performance visibility.
The result is a loop rather than a one-way report. The SEO automation platform with Ahrefs we've built around this workflow is what turns Ahrefs from a monitoring tool into an active content driver.
Skip this setup if you have under three active SEO clients and no content production process behind the dashboard. The configuration overhead pays off at scale, not for a single account.
FAQ
What is Ahrefs reporting software? Ahrefs reporting software refers to the combination of Site Explorer, Rank Tracker, and the Report Builder working together to create client-facing SEO dashboards. Each module covers a different layer: competitive and backlink intelligence, keyword position tracking, and the visual presentation that clients actually see.
How does Ahrefs Rank Tracker work for client reporting? Rank Tracker monitors keyword positions across approximately 170 countries and benchmarks them against up to five competitors per project. Depending on your plan tier, positions update daily or weekly. Built-in email reporting lets you automate delivery without third-party tools, and the tagging system lets you group keywords by topic, funnel stage, or content type so reports surface trends rather than raw position lists.
Can you automate Ahrefs reports? Partially. Rank Tracker has native email scheduling for ranking updates. The Report Builder is currently in beta with email sharing on the roadmap; right now it handles dashboard layout inside the workspace, and distribution runs through CSV exports or API access for teams building external dashboards. Full end-to-end automation typically requires combining Ahrefs exports with a workflow automation tool.
What are the best metrics to include in an Ahrefs client dashboard? Stick to five to seven metrics tied directly to the client's stated business goal. Traffic growth clients need organic traffic trend and keyword position changes. Lead-generation clients need high-intent keyword rankings filtered by position. Brand authority clients need backlink profile growth and competitive share. Everything else is noise that hides the signal.
How does Ahrefs compare to other SEO reporting tools? Ahrefs sits at the premium end of the market, with depth that tools like Semrush match but simpler platforms don't. Its particular strengths are backlink data quality, competitive intelligence, and the combination of AI Overview tracking alongside traditional rank monitoring. The tradeoff is a real learning curve and pricing that doesn't fit small agencies or local-only SEO work.
What is the Ahrefs Report Builder? Report Builder is a widget-based dashboard tool currently in beta, free on all paid Ahrefs plans including legacy tiers. It pulls data from Site Explorer and Rank Tracker into a customizable layout you can share with clients. Each workspace supports up to 50 reports and 200 widgets total, with 50 widgets per report. The current architecture is static, meaning widgets display data as of their last configuration rather than live-updating continuously.
How do you set up an Ahrefs dashboard for multiple clients? Set up a separate project in Rank Tracker for each client, configure their keyword lists and competitor slots, then build corresponding Report Builder dashboards pulling from those projects. Note that report templates don't transfer between workspaces — if you manage clients across multiple workspaces, you'll rebuild layouts per workspace. Standardizing your widget selection early saves meaningful time at scale.