
Share Automated SEO Reports Across Teams With n8n, Search Console, and One Shared View

Quick Answers
The email-based n8n template can be set up in roughly 10 minutes for many teams, from OAuth to a scheduled send. The report centers on four Google Search Console metrics: clicks, impressions, CTR, and average position. A standard build can pull the last seven days and land in inboxes every Monday morning without a manual export. Content creators watch queries with high impressions and low CTR. SEO specialists track average position and ranking drops. Executives usually want the clicks-and-impressions trend line and nothing else. Product managers follow which pages feed traffic to key features. Larger builds can span Search Console, GA4, and Google Sheets, and may need Google OAuth2 plus SMTP or a workspace token to distribute. Large raw row counts can slow analysis in some n8n configurations, so trimming to roughly ten underperforming pages tends to keep the analysis quicker.
Quick Summary
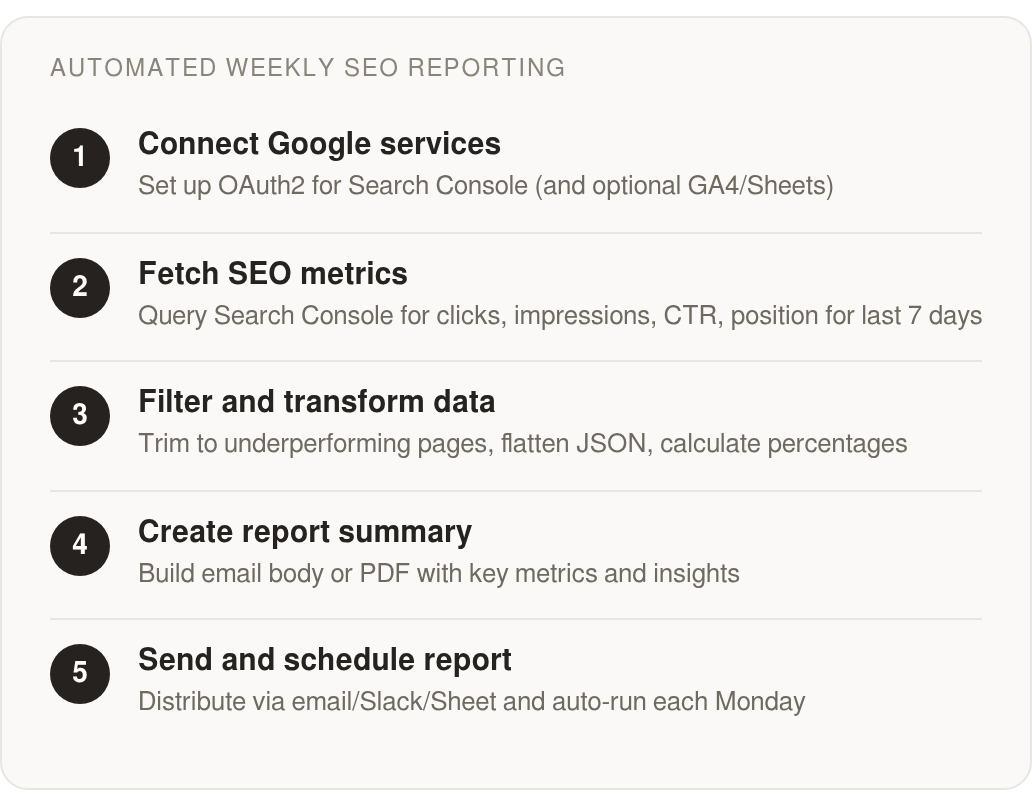
Wire Google Search Console to n8n, let it pull your numbers on a schedule, and drop a clean summary into the channel your team already lives in. One template fetches four metrics for the last seven days and arrives every Monday morning without anyone touching an export button.
Skip this build if you track a single page or report monthly by hand. For a team running a real content calendar across many pages, it keeps everyone reading the same numbers.
The Full Workflow at a Glance
| Step | What it does | Credentials needed |
|---|---|---|
| Auth | Connect GSC, and optionally GA4 and Sheets | Google OAuth2 |
| Query | Pull clicks, impressions, CTR, average position | Verified GSC domain |
| Transform | Filter keywords, track position gains and losses | None |
| Format | Build the summary (email body, or PDF) | None |
| Distribute | Send to email, Slack, or a shared Sheet | SMTP or workspace token |
| Schedule | Auto-run weekly (e.g. Monday AM) | None |
For a basic setup, the email-based template can run in about 10 minutes end to end. More detailed builds layer in GA4 and Google Sheets, so pick your depth based on what your team actually reads.
Metrics and Optional Add-Ons
The report leans on four numbers: clicks, impressions, CTR, and average position. Those four tell you what is working, what is slipping, and which pages sit one nudge away from page one.
The add-ons are where teams shape the output. A Code node—or Function node in older n8n versions—can be configured to hold more queries or format the report as a PDF for stakeholders who want an attachment. Route the summary to a shared Google Sheet for a live view, or drop it into Slack so nobody digs through email. Match the delivery to how your team communicates, not to whatever the template ships with.
What You Actually Get Out of This
Automating the loop kills the manual export step. The same numbers reach your team on schedule, and nobody assembles a deck by hand. An always-current shared view frees people to act on the data instead of compiling it.
The bigger win is the gap it closes between insight and action. When a scheduled report surfaces a page bleeding impressions with a weak CTR, that signal can feed straight into content generation, and a revised, keyword-focused post ships without a separate briefing. The report stops being a status update and becomes the trigger for the next round of content.
Why Manual SEO Reporting Quietly Eats Your Week
Most teams ask the same thing: how do I share SEO reports without turning it into a weekly chore? The move is to stop treating the report as a file and start treating it as a signal. When Search Console numbers land in the channel each person already watches, the report starts driving the next content decision instead of just documenting the last one.
Manual reporting is where alignment goes to die. Checking positions by hand drains time you don't have. Log in, filter by query, set the date range, export, paste, repeat. Automating the pull can save hours every week for teams that do this repeatedly. Every hour spent building a deck is an hour not spent fixing the pages the deck flags.
The Same Data, Read Four Different Ways
A single shared view matters because no two roles want the same slice. Content creators want queries with high impressions and low CTR, the pages worth a rewrite. SEO specialists watch average position and ranking drops. Product managers track which pages pull traffic to key features. Executives want the clicks-and-impressions trend line, nothing more.
Fragmented spreadsheets force each group to rebuild the same numbers in isolation. Two people pull the same export, filter it differently, and reach opposite conclusions in the same meeting. A shared automated feed ends that, and the alignment gains from automated reporting tend to show up fast. Everyone reads from one source that refreshes on its own, so no one argues from stale exports.
The Dataset Ceiling Is Also Your Handoff Point
Here's where speed and strategy meet. Large raw datasets can slow an in-workflow analysis step, depending on the platform and configuration, while smaller, filtered sets tend to stay more workable.
That bottleneck is the feature, not the bug. The point where a raw dataset gets unwieldy is the exact point where you want it cut down to the ten or so underperforming pages worth acting on. Workflow platforms like n8n are often better at fetching, filtering, and routing than at heavy reasoning over huge datasets, unless the input is pre-narrowed first.
Once the report surfaces those pages, feed them, not the raw dataset, into a voice-matched content engine that generates keyword-rich posts to fix them. Skip the handoff for pages already ranking well; regenerating content there is wasted effort. Reserve it for pages flagged on both axes: weak Search Console performance and thin content. Those are the highest-value rewrites, and a shared report is what points the whole team at them at once.
Connecting n8n to Google Search Console Without Leaking Credentials
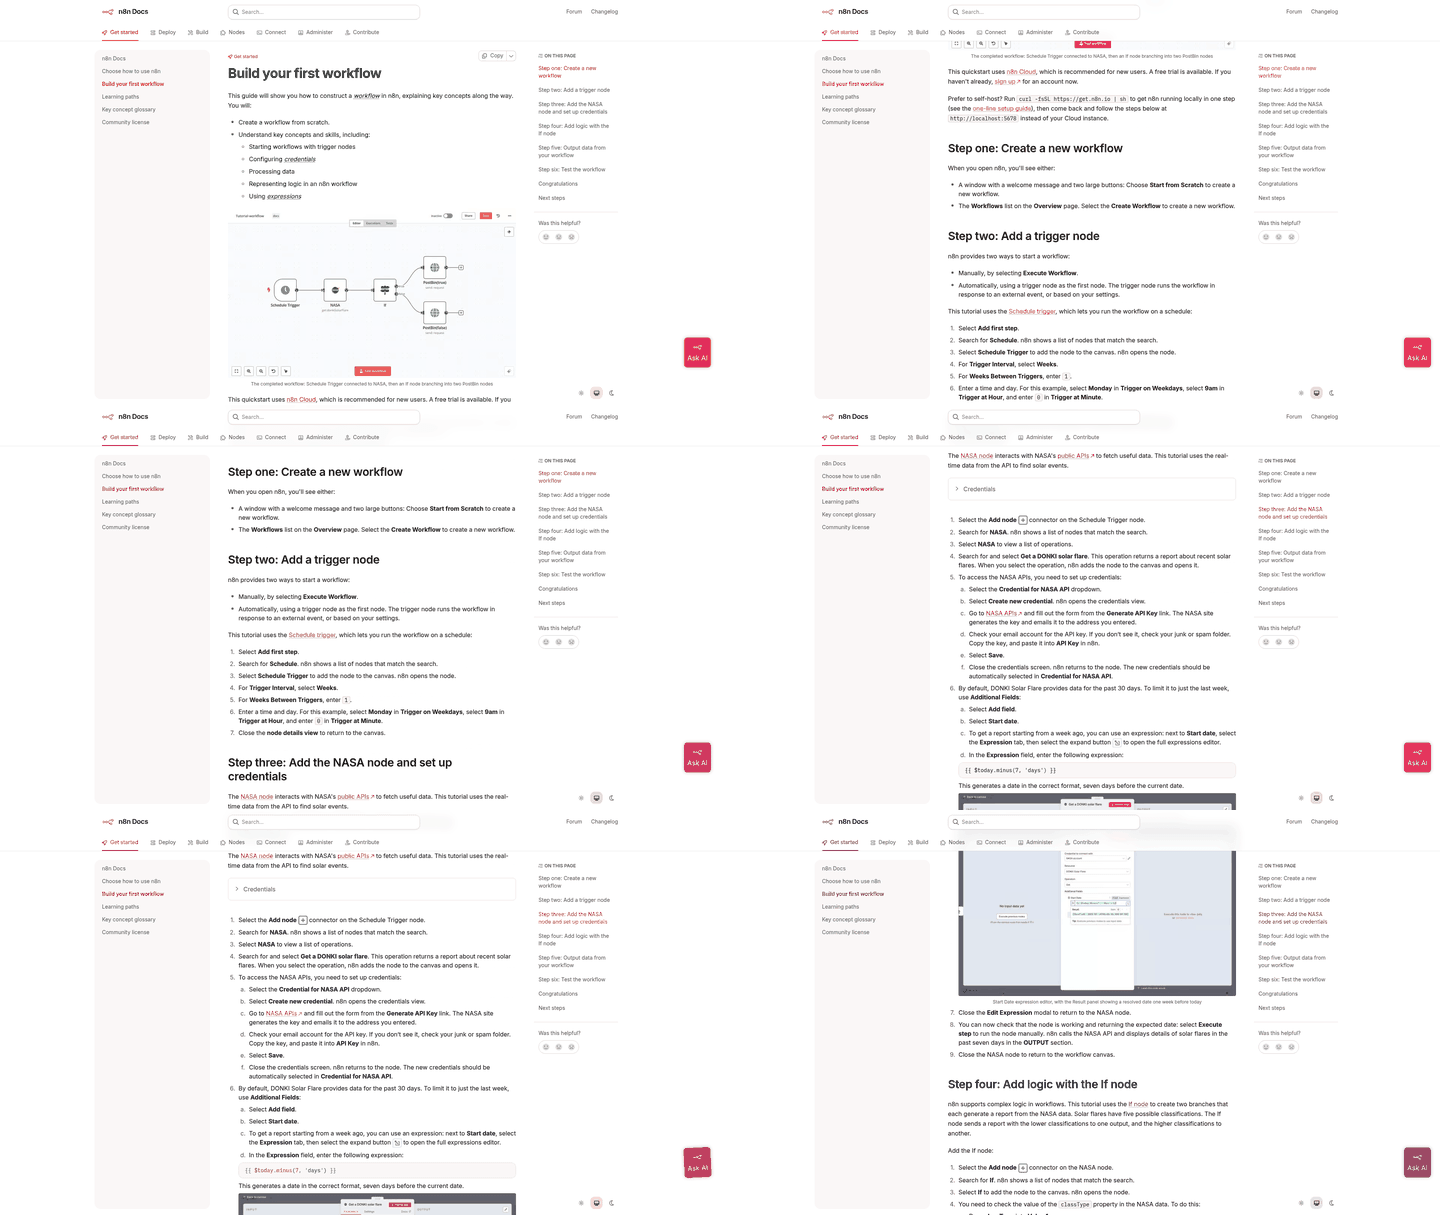
The security work happens before the first report ever sends. Getting the Google connection right is the whole game. A read-only OAuth setup means your Search Console numbers can flow into n8n, but nobody downstream can touch your actual property.
Get this layer wrong and the whole pipeline breaks. Get it right once and every scheduled report and every underperforming-page alert runs on the same trusted connection. Here's a path teams commonly use.
Setting Up the Google Cloud Project and OAuth Credentials
Start in the Google Cloud Console. Create a new project, then enable the Search Console API from the API library. That's the switch that lets any external app query your search performance data at all.
Next, generate OAuth 2.0 credentials of the "web application" type. The setting that matters most is the scope. Use https://www.googleapis.com/auth/webmasters.readonly and nothing broader. Read-only means the workflow can pull clicks, impressions, CTR, and average position, but it cannot modify your property or submit changes on your behalf.
Google hands you a client ID and a client secret. Treat the secret like a password, because that's what it is.
Importing the Credentials Into n8n Safely
Inside n8n, you can add a Google Search Console OAuth2 API credential through Settings → Credentials. Paste your client ID and secret, then run the authorization flow. Once authorized, token storage and refresh handling depend on your n8n deployment and credential configuration.
Where you run n8n shifts your security posture more than any single setting. A self-hosted deployment can keep Search Console data within your own infrastructure, depending on how it is configured. Credentials may be stored encrypted, and the secret need not appear in the workflow definition itself—which matters the moment you export or share a workflow JSON with a teammate.
Never hardcode a client secret into an HTTP Request node or a Code node. Reference it through the credential store or an environment variable. A secret pasted into a node body can end up in execution logs and shared exports. That's how leaks happen.
Two OAuth Pitfalls to Know Before You Ship
Two errors trip up almost everyone. The first is a redirect URI mismatch. The callback URL registered in Google Cloud has to match your n8n instance URL exactly, protocol and trailing slash included. One character off and the handshake fails.
The second is the scope error. If you see "Insufficient authentication scopes," your credential is missing the webmasters read-only permission. There's no clean patch for this. Recreate the credential in n8n with the correct scope, then re-authenticate from scratch.
This read-only connection is what makes the rest of the pipeline safer to automate on a schedule. The security setup isn't overhead. It's the foundation that lets a report trigger real content work instead of just landing in an inbox.
Building a Search Console Query That Actually Points to a Fix
The query body is where the report stops being a data dump and starts being a decision. A weekly summary pulling clicks, impressions, CTR, and average position for the last seven days can take about ten minutes to wire up, but only if you shape the request around what your team can act on. Get the parameters right and the report tells people which pages to fix, not just how the site did.
The core call is an HTTP POST to the searchAnalytics/query endpoint. This request is the piece that replaces the manual spreadsheet export. The trick is asking for the right dimensions and cutting the date window so the numbers are complete.

The Four Metrics That Carry a Content Decision
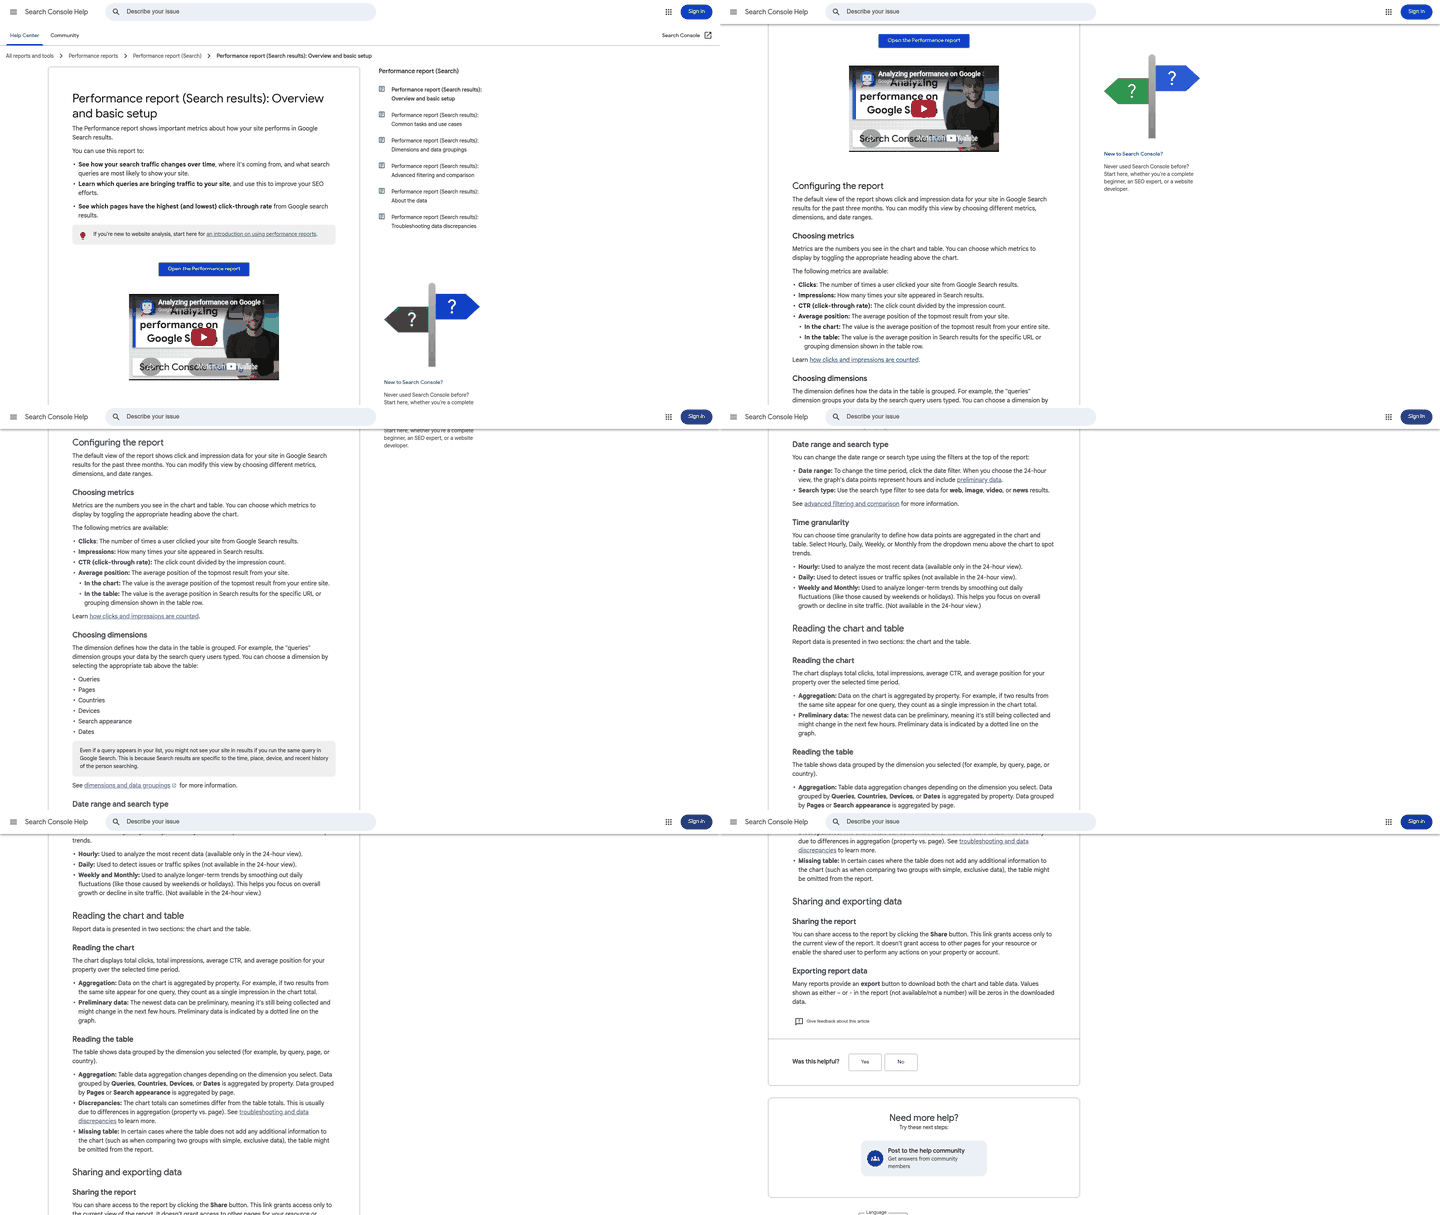
Your request body needs a start date, an end date, a search type, and the dimensions to group by. For a weekly view, set searchType to web and dimensions to ["query"] or ["page"] depending on whether you're ranking keywords or URLs.
Here's the shape of a single-window request:
Two details break more workflows than anything else. First, the site URL in the endpoint path must be URL-encoded, so https://example.com/ becomes https%3A%2F%2Fexample.com%2F. Second, very recent Search Console data can still settle or change before it is fully finalized. Setting your end date to yesterday may return provisional numbers, so pushing the window back a few days can make the report less likely to mislead.
Filters Turn a Full Property Into a Shortlist
Raw property data is noise. dimensionFilterGroups is how you cut it down to the pages worth a rewrite. Add a device filter to compare desktop against mobile, or a country filter to isolate the market you actually sell into.
A keyword-ranking flow can pull a long list of queries in one pass, which sounds useful until someone has to read it. Filter by page and sort low CTR against high impressions, and you get the pages that get seen but not clicked. Those are the ones your content engine should touch first.
The Row Ceiling That Defines Your Handoff
There's a real limit on how much data you can hand to an analysis step. Large row counts can slow an in-workflow analysis step, depending on the platform and configuration; smaller, filtered sets tend to stay workable. That ceiling isn't a bug to fix. It's the reason to narrow.
Depending on your API quota, you might process dates one at a time with a small batch size to keep your request rate steady and stay inside Search Console's usage limits. Then let the query filters trim the property down to the ten or so underperforming pages that matter. Once you know which pages are losing clicks, AnyPost.ai can generate voice-matched rewrites through its Persona Engine, so new content still sounds like your brand.
Parsing the Ugly JSON Into Something People Can Read
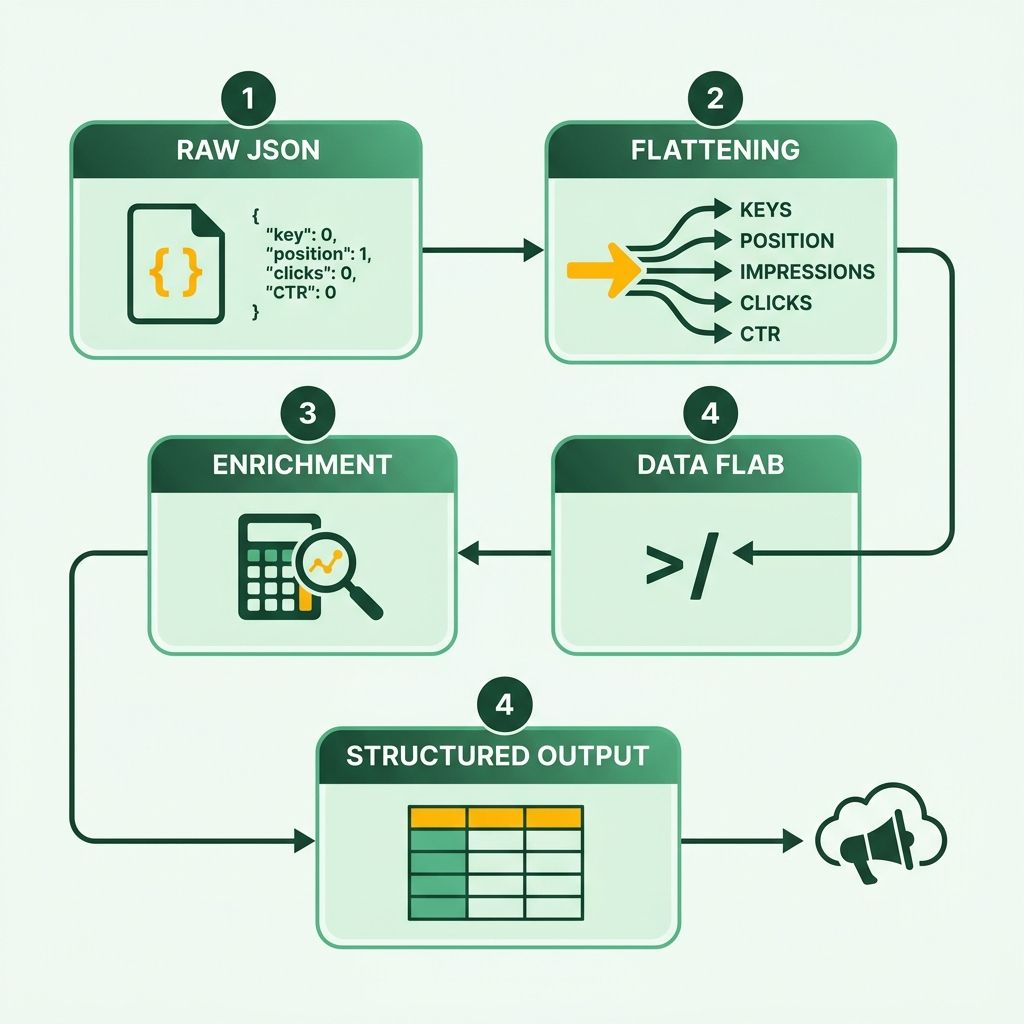
The Search Console API hands you nested JSON, not a report. Each response wraps its numbers in a rows array where every row carries a keys field plus position, impressions, clicks, and CTR. Before any of it reaches your team, you have to flatten that into something a person can scan in a channel or a sheet.
A sample row: position 12.5, impressions 847, clicks 23, ctr 0.027. Useful data, ugly format. The CTR arrives as a raw decimal and the position runs long, so cleaning comes first. Nobody wants to squint at machine output.
Mapping the JSON Rows to a Flat Array
An n8n Code node—or a Function node in older versions—handles the transform in a few lines. Loop the rows array, pull each field into a flat object, and round as you go.
Multiply CTR by 100 and it reads as 2.7% instead of 0.027. Round position to 12.5. Now each row is one clean line, ready for email, Sheets, or a chat message.
What Happens When a Page Has Zero Clicks
Missing data breaks naive pipelines. In some API responses, a no-impression query may return an empty object without a rows key rather than a row with zero values. Map straight over that and the workflow can throw an error.
Guard the transform with a check for rows before you loop. A conditional branch that checks whether the response contains a rows array can route empty responses down a separate path so the run continues instead of crashing. And treat a missing row as a signal, not noise. A page with impressions but zero clicks is exactly the underperformer worth flagging.
Enriching Rows Before They Hit the Content Engine
Raw query strings mean little without context, so enrich each row with the page title. A secondary lookup against your CMS or sitemap maps the URL to its title, turning "row 14" into "your pricing page."
Narrow the set inside n8n to the pages that are actually underperforming before passing anything downstream. That focused slice, rather than your entire index, is what you feed into AnyPost.ai's voice-matched engine. A tight, targeted set keeps the workflow fast and the output actionable.
Layer a content-quality filter on top and the targeting sharpens further. Use thresholds such as thin content under 1,500 words, title length outside 40–60 characters, or readability below a Flesch-Kincaid score of 55. Combine those with GSC underperformance: pages that lose ground in Search Console and fall below those content-quality bars become your highest-value rewrites. Pages that underperform in GSC but already meet the content bar may need technical or intent fixes; pages that are thin but still performing well in GSC are usually not the first place to spend effort.
Getting the Report to People: Email, Slack, and a Shared View
The last node in the pipeline is where the report finally reaches people, and it's the step most teams overthink. Once the data is clean, delivery is just routing. Fan out the same payload to email, Slack, and a permanent URL from one workflow run.

Each channel serves a different reader. Executives want the summary in their inbox. Analysts want the raw rows. Everyone benefits from one link that always shows the latest numbers. Serving all three from a single trigger is what keeps the pipeline from fragmenting.
Dynamic Subject Lines Make Email Worth Opening
An SMTP send node can handle distribution over SMTP. Drop in your host, port, and credentials, set the recipient, and the weekly summary can land automatically every Monday morning. For a basic setup, the whole path may run about ten minutes end to end.
The subject line is where most teams leave value on the table. A static "Weekly SEO Report" gets ignored by week three. Build the subject from the data instead, so it reads like "3 pages down in position this week." Now the inbox line flags whether anyone needs to act before they open a thing.
If leadership wants a polished artifact rather than inline text, a Code node can be configured to format the report as a PDF before it attaches. Date-stamp the filename so every send is auditable and nobody argues about which version they're reading.
Slack Puts the Report Where Work Happens
Email is where reports go to be archived. Slack is where they get discussed. With a Slack integration, you can post the same output as a rich message in the channel your team already watches.
Attach the CSV or PDF for the people who want to dig in. Use a comma delimiter with a clear header row so anyone can drop the file into a spreadsheet without cleanup. Keep the message body to the four headline metrics: clicks, impressions, CTR, and average position. Detail lives in the attachment; the channel post stays scannable.
One Shared View Beats Ten Stale Attachments
Emailed files go stale the moment they send. A permanent shared view doesn't. Publish the report HTML to an internal static site, or embed it in a Notion or Confluence page, and every team member reads from the same continuously updated source.
This is where the reconciliation pays off. If your target storage supports updating existing rows rather than appending new ones, you can re-run the workflow and let it self-correct as provisional numbers settle. The shared view stops being a snapshot and becomes a single reconciled truth. A self-hosted deployment may keep that data within your own infrastructure, depending on configuration, so the same pipeline can serve a privacy-sensitive internal audience or an external client-facing report. The deployment choice sets the trust boundary, not the workflow.
Keeping It Running Without Babysitting the Pipeline
Once the workflow runs, the question shifts. It stops being how do I share these reports and becomes how do I keep sharing them without babysitting the pipeline. The answer is a schedule you set once and a few guardrails that catch problems before they reach anyone's inbox.
A weekly send is the sweet spot for most teams. The Monday-morning template proves the point: set the cadence, walk away, and the report arrives while everyone still remembers last week's work. On a fixed rhythm, reporting turns from a chore into background infrastructure.
Cron Expressions Set the Rhythm Once
n8n's schedule trigger can use standard cron syntax. For a Monday 8 a.m. weekly report, use 0 8 * * 1. For a bi-weekly cadence, run it Mondays and pair the workflow with a simple counter or date check so it fires every other week. A daily ranking-drop check uses 0 9 * * *.
One timing rule matters more than the cadence. Search Console data for the most recent days can still be settling, so a report pulling yesterday's numbers may show incomplete metrics. Query dates that have had time to finalize, and your Monday summary is more likely to reflect reality instead of half-loaded metrics.
One Workflow, Many Domains
Agencies rarely track a single property. A common approach for handling multiple domains is to store your site URLs in a Google Sheet, read them with a Get Rows node, then loop using a batch size of 1. One property per iteration can help keep your request rate low and stay within Search Console's usage limits.
Batch size 1 also pinpoints failures. If one domain's credentials break, that iteration fails alone instead of collapsing the whole run. For large backlogs, add a short delay after each call. If your sheet supports update-style operations instead of append-only inserts, use those for re-running the same dates without creating duplicates.
Where the Analysis Belongs
Here's a scaling trap worth naming. Workflow platforms like n8n are often better at fetching, parsing, and routing data than at heavy reasoning over a full month of raw rows in a single agent step. Narrow the reporting window before analysis and each run stays lean.
That ceiling is the handoff point again. Let n8n cut the week to the ten or so underperforming pages, then feed those pages, not the raw dataset, into a voice-matched content engine that generates keyword-rich rewrites. The bottleneck becomes the trigger for the next content sprint.
Credential Rotation and Permission Audits
OAuth tokens are the weak link in any long-running pipeline. Run this checklist quarterly:
- Rotate Google OAuth2 credentials and re-authenticate the read-only
webmasters.readonlyscope. - Audit who has edit access to the workflow and the shared reporting sheet.
- Confirm SMTP and channel credentials still resolve; a silent auth failure looks identical to no news.
- Wire an error workflow that fires a Slack alert when any node fails, so a broken run never passes as a quiet week.
A self-hosted deployment may keep credentials and row data within your own infrastructure, depending on configuration, which matters the moment the pipeline touches client properties.
Frequently Asked Questions
Why do my Search Console numbers look incomplete when I pull the last few days?
Search Console data for the most recent days can be provisional and may change before it is finalized. Setting your end date to yesterday may return undercounts for clicks and impressions. Push the window back a few days so the report reflects a more settled view instead of half-loaded figures your team might act on.
Which delivery channel should I pick: email, Slack, or a shared view?
Match the channel to the reader. Executives want the summary in their inbox, analysts want raw rows in an attachment, and a permanent shared view gives everyone one continuously updated link. You can fan out the same payload to all three from a single workflow run.
What happens if a page returns no clicks or impressions?
Some Search Console API responses may return an empty object without a rows key, rather than a row with zeros, which can crash naive pipelines. Guard the transform with a conditional check for the rows field to route empty responses down a separate path. A page with impressions but zero clicks is a flagworthy underperformer.
Can one workflow report on multiple domains for an agency?
A common setup is to store your site URLs in a Google Sheet, read them with a Get Rows node, then loop using a batch size of 1. Processing one property per iteration can help keep request rates low and isolate failures, so one broken credential fails alone instead of collapsing the entire run.
My authorization keeps failing. What are the two most common OAuth errors?
A redirect URI mismatch tops the list: the callback URL in Google Cloud must match your n8n instance URL exactly, including protocol and trailing slash. The second is a scope error. Fix insufficient scopes by recreating the credential with webmasters.readonly and re-authenticating from scratch, not patching it.
Why not just feed all my Search Console rows into an analysis step?
Large row counts can slow an in-workflow analysis step and produce murky output, depending on the platform and configuration. That ceiling is the handoff point, not a bug. Narrow to the ten or so underperforming pages inside n8n, then pass that focused slice to a voice-matched content engine like AnyPost.ai for rewrites.
At AnyPost.ai, we pair Google Search Console and Google Analytics tracking with automated content generation, so the report doesn't just get read. The same performance signals feed our automated SEO reporting and the SEO-optimized, voice-matched articles that keep your site fresh.