Adapt Ahrefs’ SEO Report Template for 2026: GA4, Search Console, and Automated SEO Reports in One Workflow
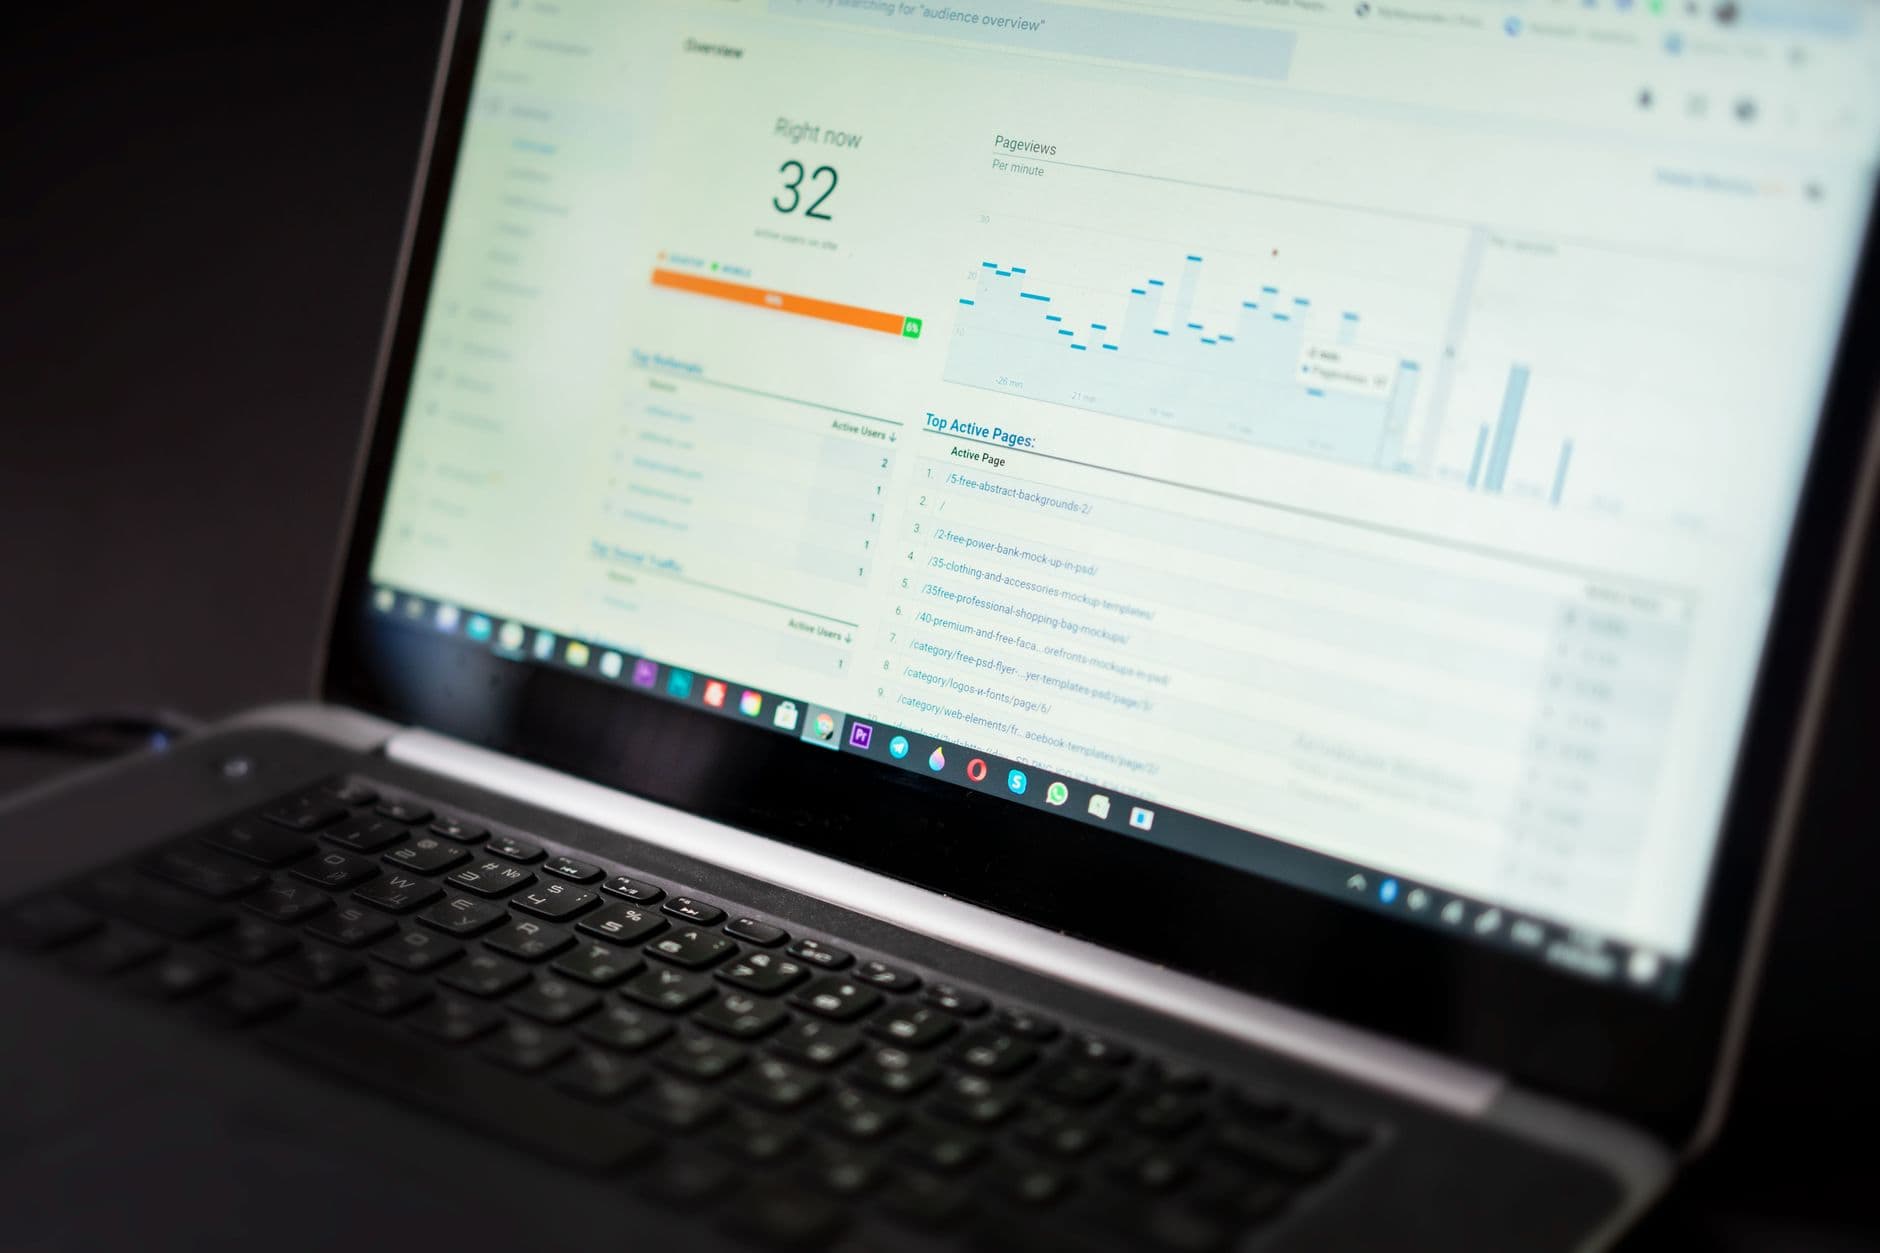
Before we get into it, the short version:
- Manual SEO reporting eats 25 to 30 percent of agency time — roughly five hours per client, per month.
- Ten clients means 50 hours monthly on reports alone. That's a full work week lost to spreadsheet assembly.
- The Ahrefs-style template strips reporting down to the essentials: GA4 users and sessions, Search Console clicks, impressions, CTR, and average position.
- Spreadsheet exports fail predictably — stale data and date-range mismatches make reports look current when they're not.
- Automated workflows compress the five-hour report into five minutes, recovering roughly 50 hours monthly across a portfolio.
- Tight metric sets, eight values instead of forty, simplify diagnosis and help you hold the dataset in working memory.
Related Video
Watch: Build Automated SEO Reporting Slides with Google Search Console and GA4 by Markifact
The part most teams underestimate isn't writing the content
Manual SEO reporting swallows time you could spend analyzing. Between pulling GA4 sessions, exporting Search Console queries, checking date ranges, and formatting everything for stakeholders, the monthly report becomes recurring production work rather than strategic review. The real cost isn't the hours spent copying numbers. It's the opportunity cost — using skilled SEO time on repeatable assembly work instead of diagnosis.

What the Ahrefs-style template actually means
The classic Ahrefs-style SEO report workflow isn't a rigid five-step formula. It's a disciplined reporting philosophy: show the few numbers that explain organic visibility, traffic, and momentum, then attach recommendations that tell the client what should happen next. The best version combines traffic data, search performance, rankings, and backlink context without turning the report into a database export.
The recommendation layer matters because raw metrics rarely create action on their own. A client doesn't need a long appendix of every query that moved. They need to know which page deserves a title rewrite, which page gains impressions but not clicks, and which content update should be prioritized before the next reporting cycle.
Where manual workflows break down
Spreadsheet exports introduce predictable failure points. Stale or delayed data can make a report look current when it's really lagging behind what's happening in the account.
We see teams automate the narrow metric set first, then add recommendation triggers once the pipeline runs reliably. The goal isn't to collect everything the API can return. The goal is to create a dependable reporting layer that answers the same questions every month: what changed, why it may have changed, and what should we do next? For more on how we structure these workflows at scale, see our guide on building an Ahrefs report generator with automated SEO dashboards.
Designing the core template: metrics that matter
When you design an SEO report template for 2026, you're not building a data warehouse. You're choosing a deliberately constrained view of performance: GA4 for audience and session behavior, Search Console for search visibility, and SEO platform snapshots for ranking and backlink context where those sources are already part of your workflow. That restraint isn't laziness. It's what keeps the report readable.
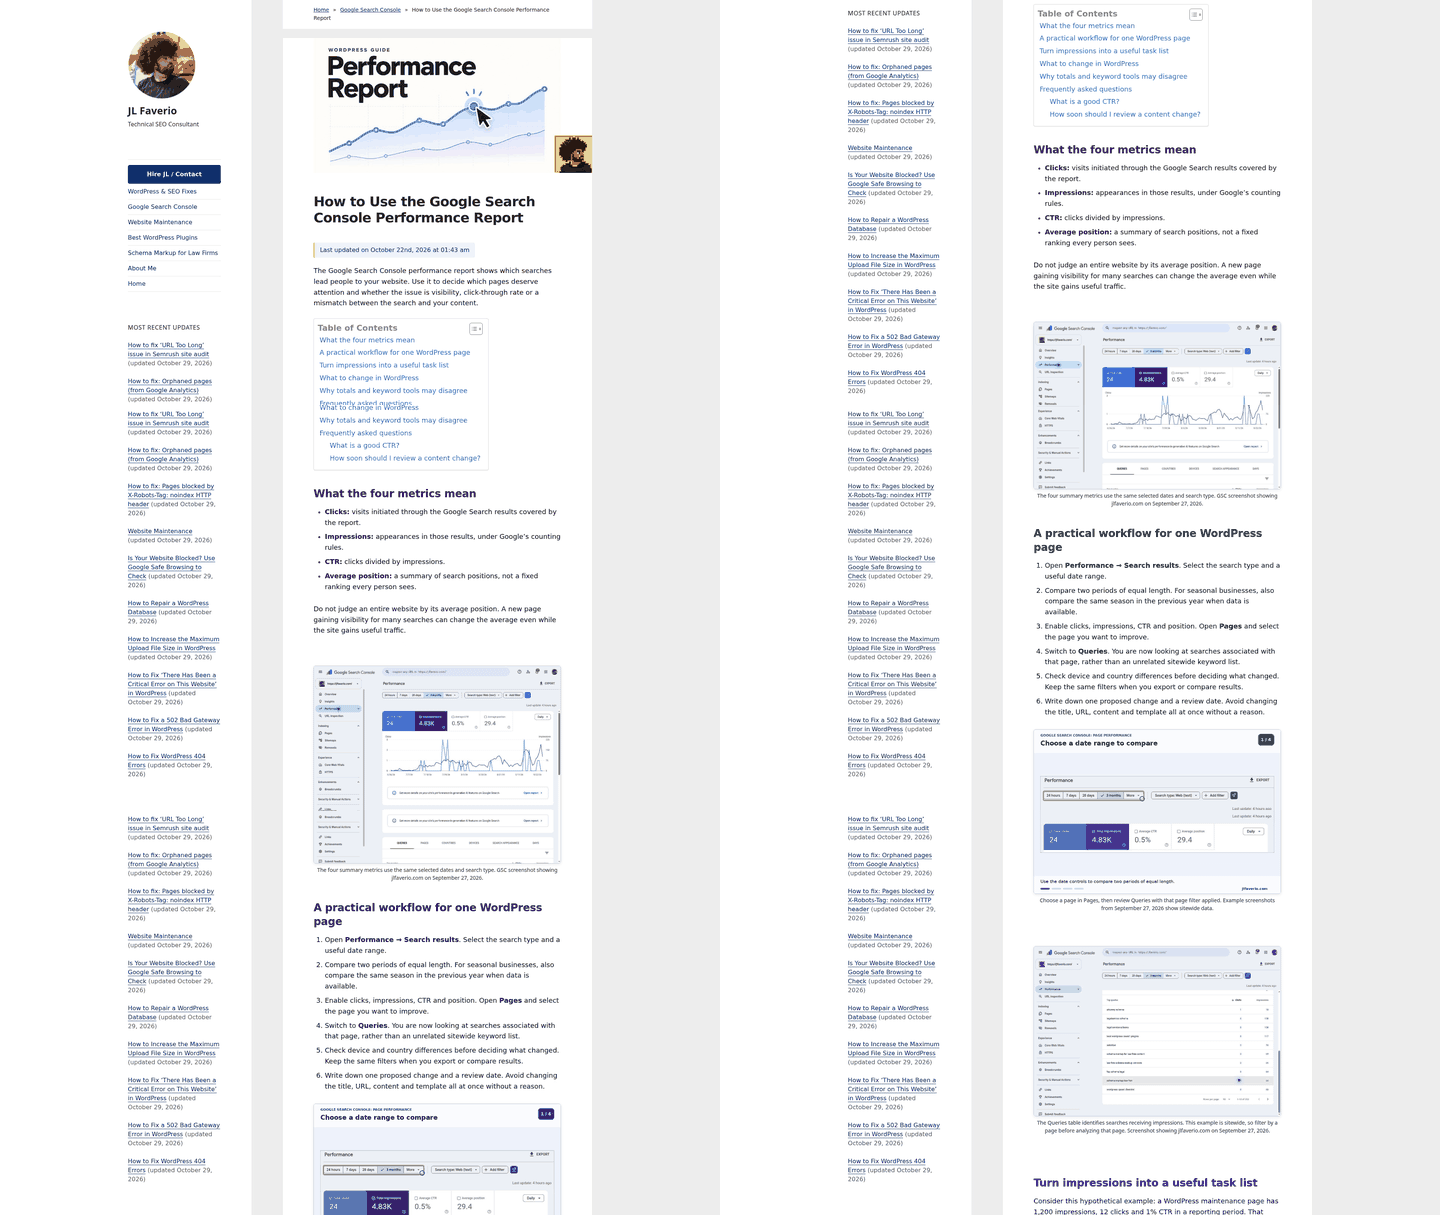
The advantage of a fixed template is consistency across your client portfolio. When every report follows the same structure, your clients learn where to look first, what each chart means, and how this month compares with the last one. That predictability compounds over time because the report stops feeling like a new document and starts acting like a shared operating system for SEO decisions.
Keep the template small to avoid decision fatigue
A reporting system becomes weaker when it tries to behave like an analytics archive. Many teams pull pages of data when their client cares about a smaller set of questions: whether organic traffic improved, which pages drove the movement, and what should be fixed next. A tighter template also makes live discussion easier because you can move from signal to interpretation without searching through secondary charts.
When impressions climb but CTR lags, review titles and meta descriptions. When sessions increase but engagement rate drops, that's a content-quality flag. When a page gains rankings but doesn't produce meaningful visits, the query mix may be less commercially useful than it looks. The template should surface these patterns automatically so you spend your time interpreting the signal, not hunting for it. An automated slide generation workflow with a constrained visual hierarchy can populate a branded deck quickly. You're not building a new dashboard every month. You're refining one system that scales.
Turning the report into action: automated publishing with AnyPost.ai
The weekly email arrives with your traffic numbers, bounce rates, and keyword positions formatted as specified. Then it sits in your inbox while you decide which pages deserve attention first. Report automation solves distribution. Action automation turns metric flags into publishing queues without manual triage.
We see teams connect report outputs directly to content workflow tools using direct integrations or scheduled exports. When a page crosses a performance threshold, the system can write a task card with the URL, the metric that triggered it, and a suggested action category. No one has to sort through last month's numbers by hand just to decide what belongs in the next editorial queue.
Building action triggers from report metrics
Start with conditional routing based on metric combinations rather than single thresholds.
| Signal | Suggested action |
|---|---|
| Gains organic visibility but weak user retention | Content refresh |
| Holds steady engagement but loses external links | Outreach |
| Performs well on both but serves outdated information | Factual update tied to recent events or product changes |
One workflow assigns priority scores by weighting recency, magnitude of change, and absolute position. A large decline should draw attention before a minor lift. You define the weights once, then let the system apply them every reporting cycle.
That handoff from report to action saves the time that used to disappear into repetitive review. The bigger benefit is consistency: the same rule set evaluates every page, every month, before a strategist decides what deserves human judgment. Automated thresholds handle the first filter. Your team handles the second.
What the workflow can and cannot do
Metric thresholds identify which pages need work. They don't diagnose root cause. When organic traffic drops significantly month-over-month, the data flags the problem but can't prove whether it came from a Google algorithm update, seasonal demand shifts, or a technical crawl issue. You still need to investigate. The automation handles repetition. You handle ambiguity.
The same constraint applies to execution velocity. A page flagged for optimization still requires a writer to draft the revision, an editor to approve it, and a developer or CMS admin to publish the update. If your content production cycle runs in scheduled sprints, a page may be identified immediately but not updated until the next available publishing window. The trigger fires as soon as the rule is met. The response depends on your team's capacity and editorial workflow.
If you need orchestration that writes briefs, assigns tasks to freelancers, tracks revision status, and notifies stakeholders when a page goes live, those capabilities require project management or workflow automation tools separate from your analytics stack. The reporting layer delivers the signal. Your production layer executes the work. The tighter you connect the two, the shorter the gap between insight and output.
Quick reference: template, tools, and setup time
When you adapt the Ahrefs "steal our SEO report" workflow into a lean automation, the finished product is a single-page dashboard that updates itself. In practice, GA4 and Search Console feed one report source, the Ahrefs-style template keeps the view deliberate, and Looker Studio or Google Sheets becomes the client-facing layer. Automated slide workflows can then reuse that same constrained metric set instead of starting a second data pull from scratch, which makes the system repeatable. The dashboard should be compact enough for a stakeholder to scan quickly, while still giving your SEO team enough context to explain the movement behind the numbers. The goal isn't to skip useful data. It's to keep the first view focused so the report invites action instead of passive reading.
The tool stack is simple. You need direct connections to your analytics platform and search performance data, then a connector to pull both streams into one place. The initial configuration varies depending on how many properties you need to verify and whether your setup is already complete. Once the connectors are configured, the template build in Google Sheets or Looker Studio takes longer the first time, then refreshes on its own each month.
Maintenance cadence and common gotchas
Daily data refreshes paired with monthly KPI reviews tend to work well. That rhythm catches ranking drops and traffic spikes fast enough to act, without turning the report into a daily ritual. A weekly check can be useful during launches, migrations, or active campaigns, but most evergreen reporting programs don't need another recurring meeting just to confirm the dashboard is still updating.
The two report checks we make before sending are date-range mismatches and post-clone filter verification. If your analytics source and search source use different default windows, the numbers will never reconcile cleanly, and stakeholders will ask why the report appears inconsistent. Cloning is subtler: a dashboard that worked in your test account can show the wrong property or date range after duplication if its selectors are not re-verified.
Quick Questions, Straight Answers
1. Is automation worth the setup time if I only manage three or four clients instead of ten?
Yes, if the report is recurring and the same data sources appear each month. Smaller portfolios will not recover as much total time as larger ones, but automation still reduces copy-paste work, formatting drift, and last-minute reporting stress.
2. Which connector should I choose between Supermetrics, Make, and Zapier for this workflow?
Choose based on the workflow you need around the data. A reporting connector is often a natural fit for direct pulls, while a workflow connector is more useful when the report needs to trigger tasks, notifications, or multi-step routing.
3. Can automated metric thresholds replace the need for manual analysis when traffic drops?
No. Thresholds are best treated as an early-warning system. They tell you where to look first, but a strategist still has to compare the page, query mix, technical state, seasonality, and recent search results before deciding what caused the change.
4. What breaks most often once an automated SEO report is running smoothly?
The failures we see most are configuration issues rather than strategy problems. Check that source windows line up and that cloned dashboards keep the intended property and date-range scope. A quick validation pass before sending the report prevents most embarrassing errors.
5. How do I convince a client to accept a standardized template instead of a custom report each month?
Frame the template as a decision tool, not a shortcut. A standardized format gives the client a familiar view of performance every month, while your commentary and recommendations stay tailored to their account. Custom insight matters; custom formatting usually does not.
