
Create a Semrush Enterprise Visibility Scorecard Using SEO Automation
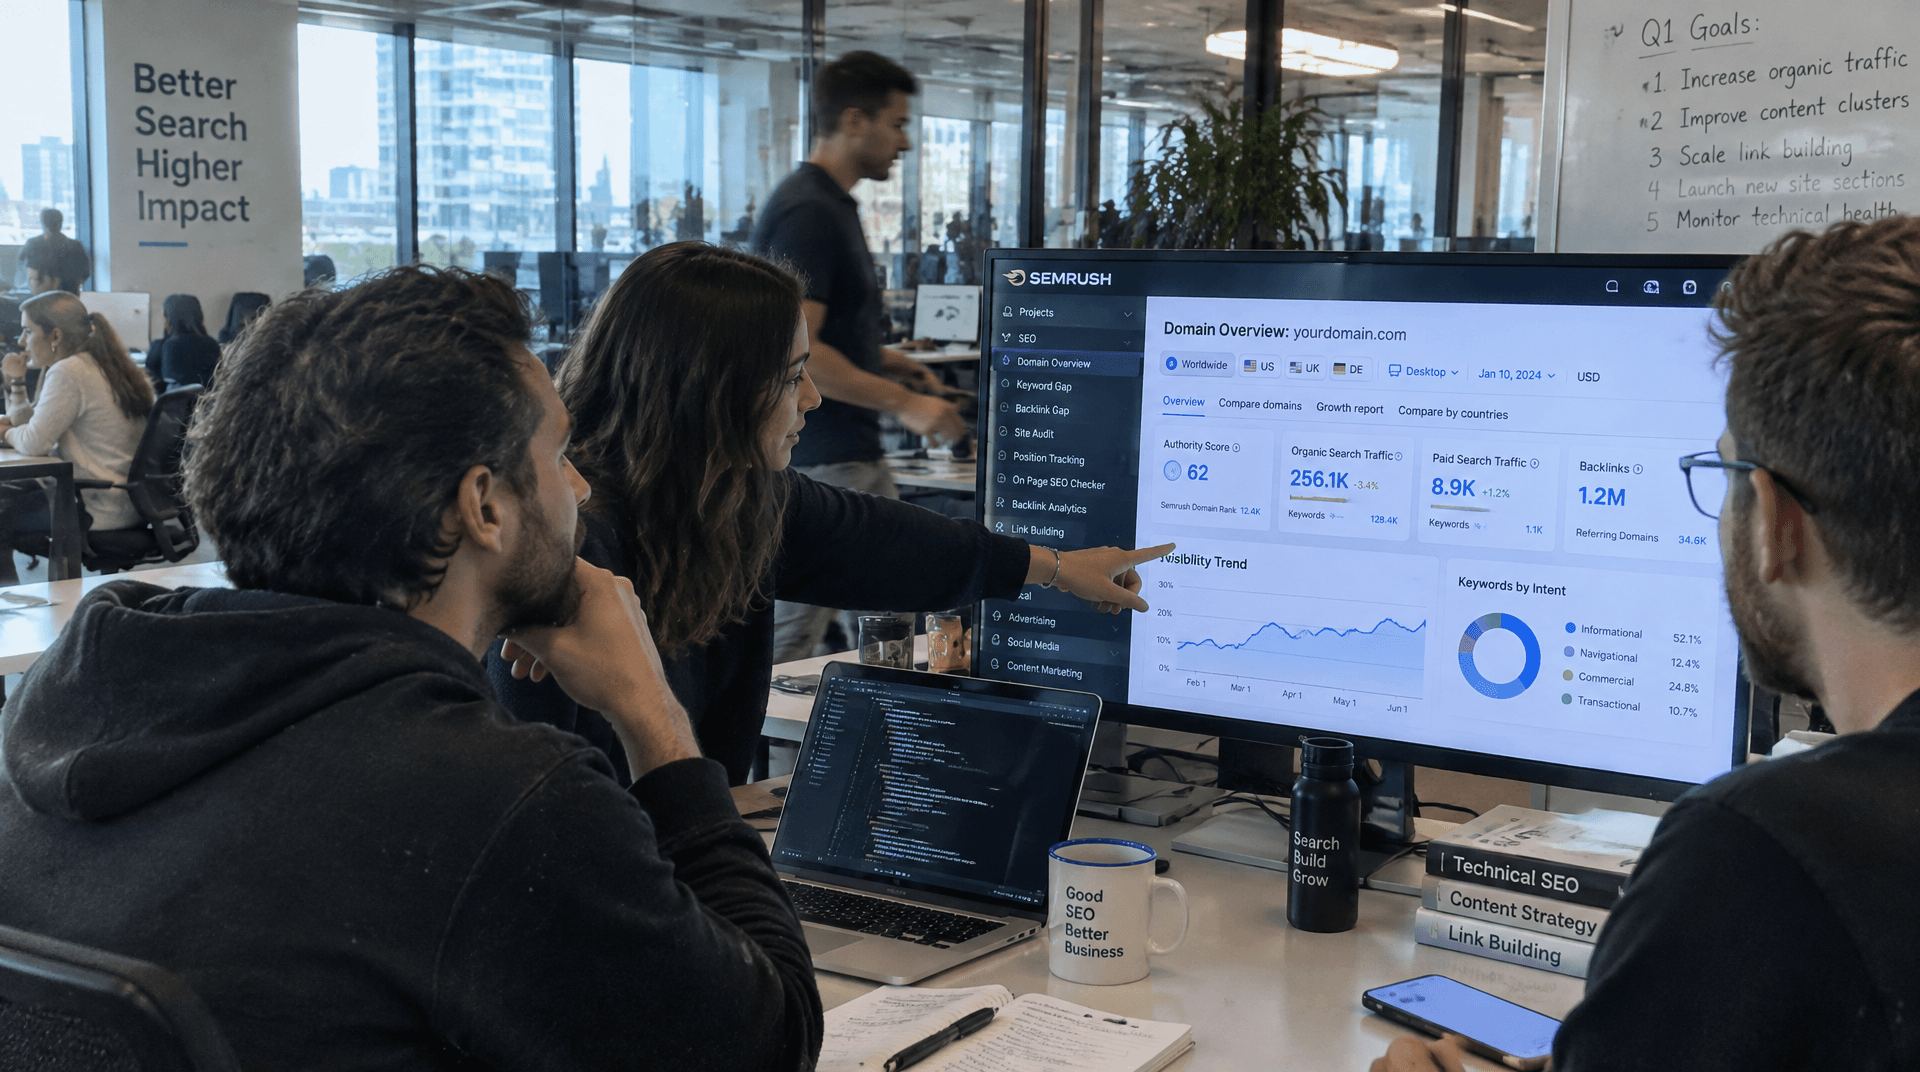
Key Takeaways
- Use a two-layer scorecard: an SEO foundation layer and an AI visibility layer, with divergence alerts for mismatches.
- Add a calibration layer using GSC and Semrush estimates.
- Small teams need six to eight weeks before patterns become actionable.
- Picsart automated internal linking across 17 languages and saved four hours a week.
- Supported automation paths include Semrush AI Visibility Toolkit CSV exports, Semrush MCP with Claude, and Supermetrics to Google Data Studio.
Quick Summary
A working enterprise visibility scorecard has two layers. The SEO foundation layer tracks organic keyword footprint, Authority Score, backlink health, technical crawl health, and Search Console actuals. The AI visibility layer tracks AI Visibility Score, share of voice, sentiment ratio, and citation health. Divergence between the two layers is often the most useful signal. If search foundations improve while AI citations stay flat, the gap likely reflects content trust or prompt relevance.
Add one calibration layer on top. Compare Google Search Console actuals with Semrush estimated traffic. The gap is your dark traffic delta—a working proxy for AI-influenced demand that standard search reporting may undercount.

Skip vanity metrics when they stand alone. Total impressions and raw traffic estimates can be useful context, but they won't tell you whether you're winning the search and AI conversations that feed pipeline.
How long these scorecards really take to pay off
Plan for six to eight weeks across two monthly cycles before treating scorecard movement as a real pattern. The build isn't the slow part. Interpretation is. Visibility shifts need enough repeated readings to separate true change from normal noise.
That lag exists because optimization work doesn't show up instantly in AI answers, organic rankings, or competitor comparisons. Treat the early dashboard as an instrumentation layer first and a decision engine second.
Where the official docs stop and your integration starts
The Semrush API documentation covers authentication and endpoint structure, but it omits the specific rank-tracking and backlink parameters a custom scorecard needs. The llms.txt index also gives AI assistants a parseable map of Semrush developer resources.
The gap shows up when you move from general access to a custom scorecard. Practical reporting fields often live outside the AI Visibility subset, so teams blend documented APIs, connector workflows, and exports instead of waiting for one tidy endpoint. If you need reporting infrastructure outside Google's stack, validate the connector path before committing to a dashboard design.
Why bother building a scorecard at all
The main benefit is seeing how signals move together: organic rankings, AI citations, backlink velocity, and technical health stop living in separate spreadsheets. When those signals update in one place, you catch mismatches earlier instead of discovering them weeks later in a leadership review.
Semrush's Picsart example makes the point. The win wasn't just efficiency. Repeatable SEO operations scaled across languages and templates. A scorecard buys the same operating rhythm. Ranking changes, citation movement, content updates, and leadership reporting stop living in separate conversations.
What a consolidated view actually surfaces
A unified scorecard surfaces patterns no single metric can. Keyword coverage can expand while AI sentiment stays flat, which points to a content-trust gap rather than a crawlability issue. Backlinks can improve while citation frequency refuses to budge, which suggests a prompt-relevance problem. Those distinctions are hard to see when every metric has its own owner, export, and reporting cadence.
Divergence alerts make this operational. When the SEO foundation layer improves but AI visibility doesn't follow, review content trust and prompt fit. When AI visibility rises but organic rankings or traffic fall, flag a possible borrowed-demand pattern instead of celebrating the AI win.
The operational friction automation removes
Fragmented tools delay insight, miss backlink opportunities the day they open up, and turn leadership reporting into manual assembly. A scorecard gives SEO, content, analytics, and executive teams one shared view of what changed, where, and which movement is worth acting on.
It also cuts the meeting load around visibility reporting. Instead of arguing over whose spreadsheet is current, the team reviews deltas, outliers, and priority fixes. That shift is usually where the value shows up first.
Pick your objective, then pick your KPIs
Build the scorecard around one question: what decisions should this dashboard inform? Executive reporting, AI-search monitoring, campaign optimization, technical risk management, and competitor benchmarking all want different KPI mixes. A dashboard built to please every audience ends up serving none.
Map KPIs to the two-layer model. The SEO foundation layer includes ranking and keyword coverage, Authority Score, backlinks, technical health, and Search Console actuals. The AI visibility layer includes AI Visibility Score, share of voice, sentiment, and citation health. Divergence alerts sit between them. If one layer moves and the other doesn't, treat the mismatch as the thing to investigate.
Matching KPIs to the job
An executive summary dashboard needs four metrics: AI citation count, share of voice versus competitors, organic traffic trend, and Authority Score. Those fit on a single screen and answer the leadership question: is brand visibility growing or shrinking against the market?
A campaign optimization scorecard wants finer breakdowns: keyword ranking movement by topic cluster, AI sentiment distribution, and citation health. Those let you spot which content themes drive AI mentions and which need retooling.
For AI visibility monitoring, prioritize share of voice, platform-specific citation counts, and prompt coverage. If your prompt universe is large, tier it: put commercially important prompts on the tightest cadence and review broader brand or awareness prompts less often.
Benchmarks and a way to prioritize fixes
Add a calibration layer before you trust the dashboard. Compare Google Search Console actuals with Semrush estimated traffic for the same pages. The dark traffic delta is the gap between them. A widening gap can signal AI-influenced demand that standard search reporting misses, so treat it as a working proxy rather than a pure tracking error.
Authority Score is a useful reference for competitive analysis because it rolls backlink strength and domain-level trust into one number. Don't treat it as a universal predictor, though. AI platforms weigh authority, freshness, topicality, and source formatting differently.
When the scorecard flags several issues at once, prioritize with the formula: (Impact × 2) − (Implementation cost + Approval friction). Count organic risk as part of the drag. A high-impact, low-cost change without legal or regional approval friction scores higher than a moderate-impact change requiring three departments. Not every red metric deserves a same-day response.
Automate data retrieval without a developer on standby
Most teams stall by assuming automation means writing API code. The workable path uses a mix of exports, third-party connectors, and AI-assistant integrations. You don't need a single "visibility score" endpoint; you need a reliable refresh routine.
The automation paths that actually exist
Three low-code approaches cover most scorecards. The first is the AI Visibility Toolkit export workflow for share of voice, sentiment, and citation presence. The second is a Supermetrics-to-Looker Studio setup, which handles authentication and lets you focus on blending, filters, and layout. The third is the Semrush MCP server, which can wire Semrush data into tools like Claude, Cursor, VS Code, and ChatGPT through a Model Context Protocol workflow.
That mix matters because scorecards rarely lean on one source. You might need AI prompt-level visibility from one export, organic footprint data from another report, and Search Console actuals from Google. The real decision isn't elegance. It's reliability.
Scheduling refreshes without code
For daily or weekly updates, use connector-based pulls rather than webhooks or custom scheduling scripts. Set Supermetrics to refresh your Google Data Studio report on a recurring cadence.
Where AI Visibility Toolkit metrics don't flow through a connector, run a controlled export routine. Store snapshots in a shared folder, use a naming convention with report type and date, and keep one canonical version feeding the dashboard. If a metric stays flat long enough that it stops informing decisions, slow its refresh and reserve daily checks for volatile, high-priority signals.
Set alerts, benchmark rivals, and let the reporting run itself
Alerts should fire on changes that would alter a decision: whether to refresh a cluster, protect a declining page, investigate lost citations, update executive commentary, or escalate a technical issue. Anything else belongs in the trend view, not the notification layer.
Design publish-event alerts, not just post-publish movement alerts. Before a page ships, score the expected AI visibility lift against organic risk. If the score falls below your threshold, route the page to review instead of default publishing. That makes the scorecard a go/no-go system for content launches, not just a rearview mirror.
Benchmarking competitors
Compare the same competitors, prompts, and reporting windows each time. Let those inputs drift and your benchmark becomes a moving target.
Start with competitor baselines across both layers. Pull organic keyword counts, Authority Score, and estimated traffic from Semrush domain analytics to establish the SEO foundation. For the AI layer, track competitor share of voice, sentiment ratios, and citation frequency across the prompt set that matters to your category.
Thresholds worth an alert
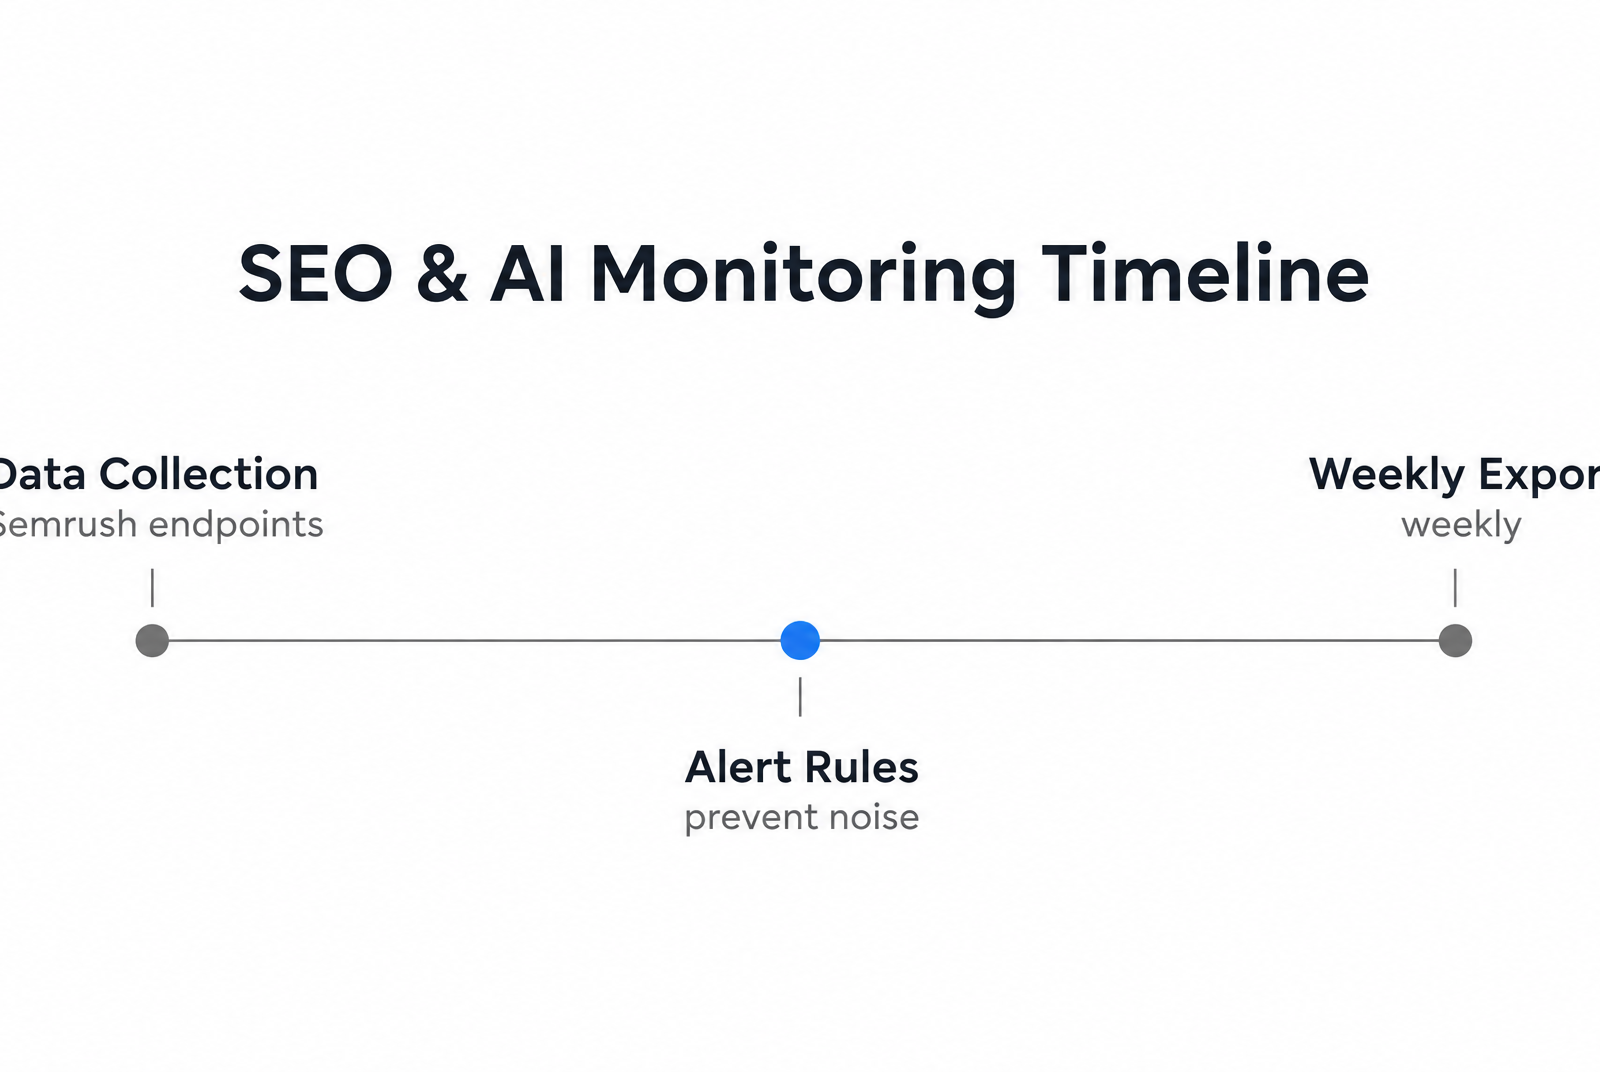
Custom alert rules keep the noise down. Use ranking-loss alerts for priority terms, Authority Score alerts for meaningful domain-level declines, and AI share-of-voice alerts when a rival overtakes you in a monitored prompt group. Technical crawl issues and backlink velocity deserve their own rules too.
You can connect the pipeline through Supermetrics linking Semrush analytics, which tends to cut the manual overhead of stitching reports together. Pair that with a disciplined AI visibility export routine so sentiment and citation columns stay current in the stakeholder view. From there, the work shifts from assembling the data to acting on it, which is the whole point of building the thing.
Questions People Ask
1. How long does it realistically take to see actionable patterns in a new visibility scorecard?
Treat the first phase as setup and calibration, not final judgment. You need enough repeated measurements to see whether movement is persistent across prompts, rankings, and competitors instead of reacting to one noisy snapshot.
2. Can I build a Semrush visibility scorecard without a developer on the team?
Yes. A non-engineering team can start with Semrush exports, connector-based reporting, and MCP-assisted querying rather than building a custom API pipeline from scratch. The key is to standardize the refresh process so the dashboard does not depend on one person manually rebuilding it each week.
3. Why does keyword footprint matter more than individual page rankings for AI visibility?
Individual rankings show page-level performance. Keyword footprint shows whether your brand has enough topical coverage for AI systems to recognize it across a category. For enterprise reporting, that broader view is usually more useful than celebrating a small set of isolated ranking wins.
4. Which alert thresholds prevent noise without missing competitive moves?
Alert on changes that would trigger a real response: priority keyword losses, authority declines, competitor gains in monitored prompts, crawlability drops, or backlink losses. If nobody would act on the alert, it belongs in the dashboard trend view rather than the notification layer.
5. What does the Semrush API documentation actually cover for custom scorecards?
Use the developer documentation for access patterns and general API structure, then confirm the specific report parameters you need before designing the final scorecard. In practice, most teams combine documented API paths with connectors and exports so they are not blocked by one missing method.